CRUDEOIL MCX MOMENTUM CATCHThis Chart is only for educational purpose. Do your own analysis before taking any trading decisions.
WTI1! trade ideas

Planning the Trade: Crude Oil Scenarios in a Shifting Macro LandNYMEX:CL1!
In volatile times, both opportunities and risks increase. Traders gain the ability to be more selective, adapting to new market regimes by adjusting risk and trade management strategies. Key tools in this process include indicators such as the Average True Range and Close-to-Close volatility sigma bands. April 20, 2020: A historic day, WTI Crude Oil prices traded negative for the first time, and we have yet another volatile April.
"If you fail to plan, you are planning to fail." Preparation is essential before taking on the market head-on.
Many participants choose to stay on the sidelines when volatility exceeds 1 standard deviation. Others, however, see this as an opportunity—adapting their risk per trade, adjusting targets, and refining trade management. Reducing position size can be an effective way to manage periods of heightened volatility.
This Week's Trade Idea: Crude Oil
We'll be reviewing Crude Oil price action with updated levels, fresh insights, and framing a trade plan with an example idea for reference.
Key Levels:
• April Monthly Open: 70.75
• 2025 mCVPOC: 71.13
• Yearly Open: 69.64
• 2024 Mid: 69.52
• 2025 Developing Mid: 66.52
• 2025 mCVAL: 65.08
• March 2025 Low: 64.37
• 2022 CVAL: 61.60
• 2024 Low: 59.91
The recent announcement of reciprocal tariffs, coupled with OPEC+ production plans (though scheduled earlier), and the rising uncertainty around a possible recession, have collectively weighed on demand expectations—resulting in a significant decline in oil prices. Although the 2024 low was reclaimed and prices have remained above this level, the sustainability of this recovery remains uncertain.
Scenario 1: Push Higher Towards 2025 Mid
In this scenario, we anticipate prices closing above March lows. Price then pushes higher toward the 2025 developing mid-range, re-entering the 2025 micro composite value area (mCVA).
Example Trade Idea:
• Timeframe: Hourly
• Setup: Wait for a candle close above March lows. Look for a pullback reaction off the 2025 Value Area Low (VAL).
• Entry: 64.50
• Stop: 64.00
• Target: 66.50
• Risk: 50 ticks
• Reward: 200 ticks
• Risk/Reward Ratio: 4R
________________________________________
Scenario 2: Range-Bound Price Action
In this scenario, the March low acts as strong resistance, aligning with the 2025 mCVAL. Price reverts lower towards the 2022 CVAL.
Example Trade Idea:
• Setup: Watch for signs of buyer exhaustion near March lows. If sellers regain control, look for a move back down toward 2022 CVAL.
• Timeframe: Hourly
• Entry: 64.00
• Stop: 64.40
• Target: 62.00
• Risk: 40 ticks
• Reward: 200 ticks
• Risk/Reward Ratio: 5R
________________________________________
Important Notes:
These are example trade ideas provided for educational purposes and are not intended as trade recommendations. Traders should perform their own analysis and thorough preparation before entering any positions.
Please be aware that stop losses are not guaranteed to trigger at the specified levels, and actual losses may exceed predetermined stop levels.
________________________________________
Glossary:
• VA: Value Area
• VPOC: Volume Point of Control
• VAL: Value Area Low
• C: Composite (used as a prefix: VA, VAL, VAH, VPOC, etc.)
• mC: micro Composite (used as a prefix: mCVA, mCVAL, etc.)

US OILCrude Oil
- Bullish Channel as an corrective pattern in Short Time Frame
- Break of Structure
- Fibonacci Level - 61.80%
- Change of Characteristics
- Completed " 12345 " Impulsive Waves and " A " Corrective Waves

Business cycle telling us something right now.Business cycle telling us something right now.
Energy and short term yields on a slippery slope.
I just don't get those bullish on the economy.

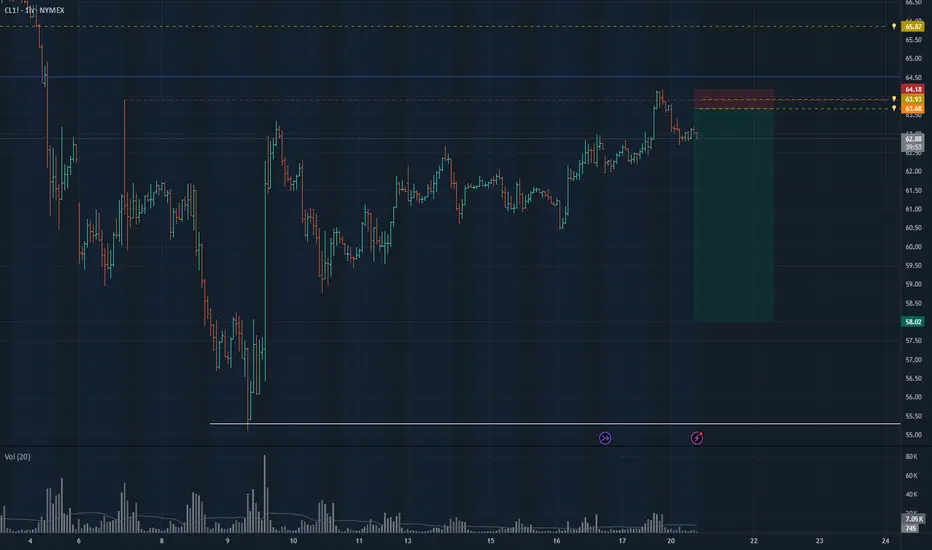
Short CL, RR 1:11Setup: Short trade based on a potential liquidity grab.
Trade Setup:
Short Entry: 63.68.
Stop Loss: 64.18 (a reasonable stop above the liquidity grab zone to account for potential fakeouts).
Risk-Reward Ratio: 1:11, which suggests a highly favorable trade setup if the target is achieved.
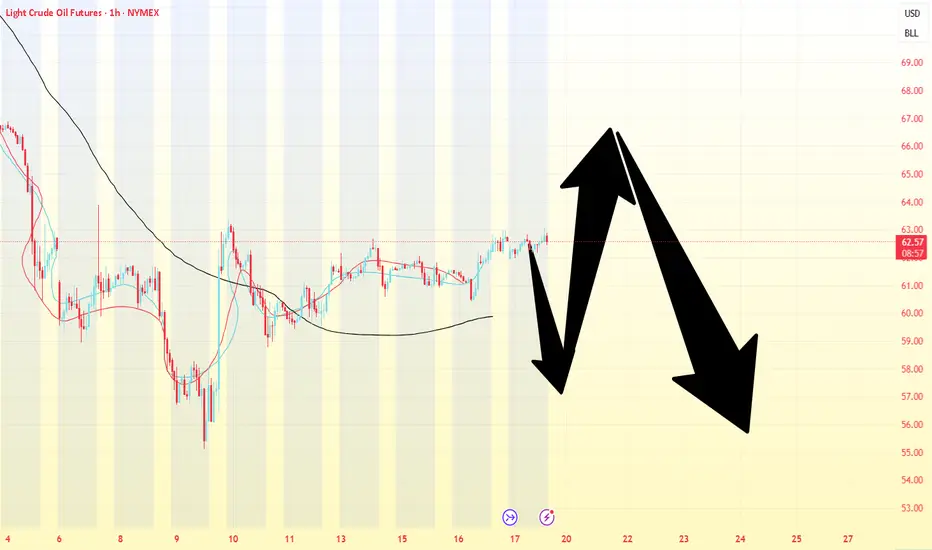
Weekly Market Forecast WTI CRUDE OIL: Bearish! Wait For SellsThis forecast is for the week of April 21 - 25th.
Oil has made a classic bearish impulse down, then a corrective retracement. The natural expectation is another impulse down. The fact that price pulled back into a W -FVG allows for this bearish expectation.
Wait for a bearish break of market structure to confirm a valid sell setup... and trade accordingly. No confirmation, not trade!
Check the comments section below for updates regarding this analysis throughout the week.
Enjoy!
May profits be upon you.
Leave any questions or comments in the comment section.
I appreciate any feedback from my viewers!
Like and/or subscribe if you want more accurate analysis.
Thank you so much!
Disclaimer:
I do not provide personal investment advice and I am not a qualified licensed investment advisor.
All information found here, including any ideas, opinions, views, predictions, forecasts, commentaries, suggestions, expressed or implied herein, are for informational, entertainment or educational purposes only and should not be construed as personal investment advice. While the information provided is believed to be accurate, it may include errors or inaccuracies.
I will not and cannot be held liable for any actions you take as a result of anything you read here.
Conduct your own due diligence, or consult a licensed financial advisor or broker before making any and all investment decisions. Any investments, trades, speculations, or decisions made on the basis of any information found on this channel, expressed or implied herein, are committed at your own risk, financial or otherwise.

CrudeOil climax rise or more to blast upsidePrice chart read from 2022 High to recent low. All depiction marked as per #ElliottWave, #Supplu-Demand & #Liquidity concept. Price action of 1-2 week will be clear indication of which way its going to unfold. More Bullish if closing above given level or its going to form a important top.

For Educational purpose only.The primary objective of the trading strategy is to generate consistent returns while managing risk effectively. Define whether you are trading for short-term profits, long-term growth, or a combination of both.

Crude Oil - Bearish longer term biasCrude has recently broken its multi-year support level at $67. A retracement back toward that level is probable to cap any upside. The aligning overhead previous POC, Fib, and bearish descending wedge breakout argues for further continued weakness over the medium term.
The longer term target level of $45 coincides with previous resistance following the all time lows rebound in 2020, and also an untested POC at ~$43.75.

CRUDE OIL... Time to BUYPreviously posted and heads up...
Did not quite work immediately because of POTUS and the Trade War II/
Did a cliff dropper and now it looks about ripe for the rally, confirmation when it is above the resistances shown.
Heads up!

The pivotal technical threshold is $65 for the price of oil The price of US crude oil broke a major technical support in April
The price of oil gave a technical red alert at the beginning of April after breaking a major long-term support, all against a complicated fundamental backdrop: the so-called reciprocal tariff trade war, geopolitical tensions and internal divisions within OPEC+.
The immediate consequence: a sharp fall in prices, the steepest since the health crisis of 2020. Does this fall reflect economic reality, or is it the result of excessive negative sentiment?
WTI has broken the technical threshold of $65, a pivotal level which had been the market peak ahead of the health crisis in early 2020. This multi-year support gave way under the blows of a market frightened by the prospect of a global recession, whereas it had been preserved since last September. But therein lies the nuance: it's not the recession itself that's at work, but the anticipation of a slowdown, fuelled by daily political and commercial volatility.
At a fundamental level, the fall in the price of oil represents several factors:
- The increased probability of a global economic recession linked to the uncertainty of the prospective international trade framework.
- The new all-time record in US oil production and the Trump Administration's intensive drilling policy.
- Strong dissension among OPEC+ member countries, which ultimately led to an increase in oil supply of over 400K barrels/day from May onwards, i.e. three times the volume initially forecast
- Uncertainty over the evolution of global demand and rising production, it was this new supply/demand ratio that led to the break of the $65 technical support on US crude at the beginning of April.
$65 is therefore the fundamental and technical pivot for the price of oil
The message is twofold. Technically, the signal is crystal-clear: oil has broken a major support. Fundamentally, the scenario of a recession remains hypothetical, as the economic data have not yet validated it. The market is anticipating, often too fast, often too hard.
An analysis of the historical price of US oil shows that the $65 threshold is a kind of frontier between optimistic and pessimistic economic expectations. Clearly, if the market holds below this resistance level, it will be a sign of a trade war that is still a long way off trade agreements. On the other hand, a return to the $65 mark would signal a return to a stable trading environment and a rise in the price of oil towards $80.
Finally, from a macro point of view, an oil price below $65 could accelerate the disinflation process, bringing the FED closer to a pivot. April's fall in the price of oil on the commodities market would therefore be a blessing in disguise.
DISCLAIMER:
This content is intended for individuals who are familiar with financial markets and instruments and is for information purposes only. The presented idea (including market commentary, market data and observations) is not a work product of any research department of Swissquote or its affiliates. This material is intended to highlight market action and does not constitute investment, legal or tax advice. If you are a retail investor or lack experience in trading complex financial products, it is advisable to seek professional advice from licensed advisor before making any financial decisions.
This content is not intended to manipulate the market or encourage any specific financial behavior.
Swissquote makes no representation or warranty as to the quality, completeness, accuracy, comprehensiveness or non-infringement of such content. The views expressed are those of the consultant and are provided for educational purposes only. Any information provided relating to a product or market should not be construed as recommending an investment strategy or transaction. Past performance is not a guarantee of future results.
Swissquote and its employees and representatives shall in no event be held liable for any damages or losses arising directly or indirectly from decisions made on the basis of this content.
The use of any third-party brands or trademarks is for information only and does not imply endorsement by Swissquote, or that the trademark owner has authorised Swissquote to promote its products or services.
Swissquote is the marketing brand for the activities of Swissquote Bank Ltd (Switzerland) regulated by FINMA, Swissquote Capital Markets Limited regulated by CySEC (Cyprus), Swissquote Bank Europe SA (Luxembourg) regulated by the CSSF, Swissquote Ltd (UK) regulated by the FCA, Swissquote Financial Services (Malta) Ltd regulated by the Malta Financial Services Authority, Swissquote MEA Ltd. (UAE) regulated by the Dubai Financial Services Authority, Swissquote Pte Ltd (Singapore) regulated by the Monetary Authority of Singapore, Swissquote Asia Limited (Hong Kong) licensed by the Hong Kong Securities and Futures Commission (SFC) and Swissquote South Africa (Pty) Ltd supervised by the FSCA.
Products and services of Swissquote are only intended for those permitted to receive them under local law.
All investments carry a degree of risk. The risk of loss in trading or holding financial instruments can be substantial. The value of financial instruments, including but not limited to stocks, bonds, cryptocurrencies, and other assets, can fluctuate both upwards and downwards. There is a significant risk of financial loss when buying, selling, holding, staking, or investing in these instruments. SQBE makes no recommendations regarding any specific investment, transaction, or the use of any particular investment strategy.
CFDs are complex instruments and come with a high risk of losing money rapidly due to leverage. The vast majority of retail client accounts suffer capital losses when trading in CFDs. You should consider whether you understand how CFDs work and whether you can afford to take the high risk of losing your money.
Digital Assets are unregulated in most countries and consumer protection rules may not apply. As highly volatile speculative investments, Digital Assets are not suitable for investors without a high-risk tolerance. Make sure you understand each Digital Asset before you trade.
Cryptocurrencies are not considered legal tender in some jurisdictions and are subject to regulatory uncertainties.
The use of Internet-based systems can involve high risks, including, but not limited to, fraud, cyber-attacks, network and communication failures, as well as identity theft and phishing attacks related to crypto-assets.

Let the Revaluation Continue-Oil to 250 by 2035Oil is roughly as cheap as ever denominated in gold. A significant upside move is due, repricing oil accordingly with gold

Crude oil---sell near 63.90, target 60.00-58.00Crude oil market analysis:
The recent crude oil has been delivered. The new contract is relatively strong at present. Yesterday's daily line closed with a positive line. In the short-term bottom shock, we are still bearish on crude oil today. We continue to sell. The large pattern suppresses around 65.30. The daily moving average suppresses around 65.700, which means that buying needs to break this position to reverse. Today's crude oil is suppressed at 63.90.
Operational suggestions:
Crude oil---sell near 63.90, target 60.00-58.00
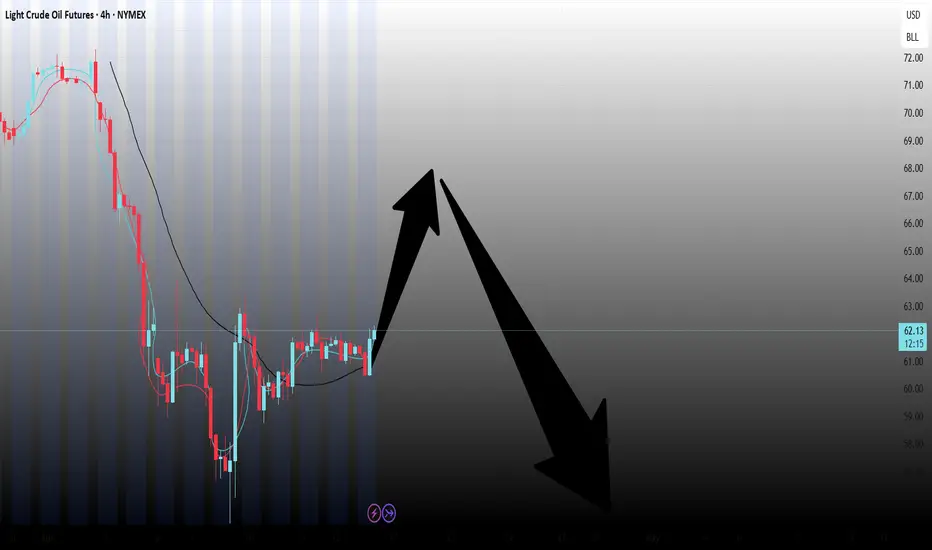
Possible upward pullbackCrude oil is on a bearish trend based on higher timeframes but is currently showing bullish pressure as a potential pullback. The potential upward pullback may try to retest the 70.0 barrier. Breaking further and settling above the 70.0, may see a rise towards resistance barriers between 71.00 and 73.00 as potential bearish sell zones.

Crude oil---sell near 62.00, target 60.00-59.00Crude oil market analysis:
The crude oil pattern shows that it is starting to hover at the bottom. Continue to sell when it rebounds. If the 65.30 position is not broken, you can stick to the bearish idea. The recent tariffs and fundamentals of crude oil make it difficult to rise, and the previously announced inventory data has also increased a lot. Crude oil rebounds to 62.00 today and can be sold. If it breaks, the next selling position is around 63.80.
Fundamental analysis:
There are not many data this week, but there are still many fundamentals. Note that the market will rest on Friday this week, which is Good Friday.
Operation suggestions:
Crude oil---sell near 62.00, target 60.00-59.00
Crude oil---sell near 64.00, target 62.00-60.00Crude oil market analysis:
Crude oil has been falling recently. Under the pressure of tariffs, the decline of crude oil is very large. In addition, the previously released crude oil inventory data also shows its weakness. The weekly line closed with a cross star, and the lower shadow is very long. The possibility of a unilateral decline in crude oil this week is small, and the possibility of fluctuations is greater. The position of 65.30 is its suppression. Look for selling opportunities in the Asian session of 63.50-65.30 today. The other 58.00 of crude oil is support.
Operational suggestions:
Crude oil---sell near 64.00, target 62.00-60.00
Go Long: Crude Oil's Undervaluation Signals Potential Upside Nex- Key Insights: Crude Oil is facing bearish pressures, but inventory analysis
reveals significant undervaluation, with an implied fair value of $92.
Seasonal trends and insider confidence in energy stocks further support
potential upside. Watch for geopolitical developments and OPEC actions that
might influence price movement.
- Price Targets:
- T1: $63.50
- T2: $64.94
- S1: $60.50
- S2: $60.00
- Recent Performance: Crude Oil prices closed below key support levels after a
consistent downtrend due to geopolitical tensions and recession fears.
Speculative positions remain at historic lows, reflecting widespread market
pessimism despite valuations and long-term prospects in the energy sector.
- Expert Analysis: Analysts highlight undervaluation driven by commercial
inventory data. Electric vehicle adoption is steadily reducing oil demand,
yet insider buying in Canadian energy stocks reveals confidence in a
recovery. Geopolitical risks, including Iranian sanctions and SPR refill
speculation, might temporarily impact price volatility.
- News Impact: OPEC's surprise production hikes have balanced market pressures
between bullish and bearish forces. Uncertainty in energy policy and delayed
CapEx decisions could limit medium-term production. Canadian elections could
further drive sentiment if pro-oil policies emerge post-election.

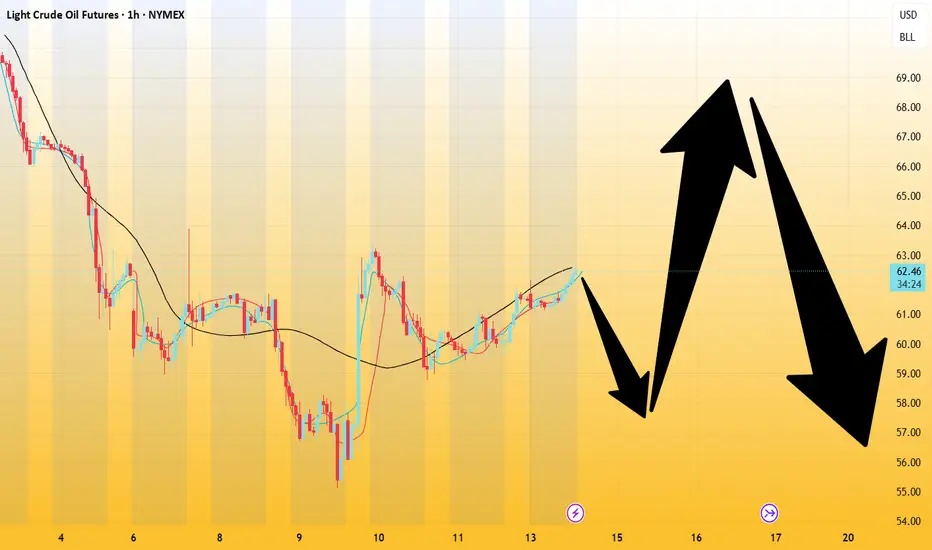
COT report showing big players buying oil for the coming weekafter reading the COT report/ and oil hitting heavy lows from last week.
COT report is showing big institutional players are buying oil for the coming week.
as we can see, buyers have already entered the market. we may get a pullback down to
57.0000 area before a push up, looking to take profit around 67 /68.00000 4 hour support
areas.

I've Cracked the BULLISH Code in Crude Oil Using COTCrude oil is setup for longs based on fundamental conditions underlying the market place.

Crude oil------sell near 63.00, target 60.00-57.00Crude oil market analysis:
The recent daily crude oil line is still not very strong. There was a rebound, but it was just a rebound. Gold rose strongly, but crude oil did not rise strongly. Yesterday's crude oil also ran down slightly. Today's crude oil is still around 63.00 and 65.00, which are opportunities to consider selling. If it continues to decline and stabilizes around 57.00, buy it back. Crude oil does not reflect the fundamentals so strongly.
Fundamental analysis:
The CPI announced yesterday did not have a big impact on the market, but the data difference was still relatively large, and the result was -0.1%. The bulls only rose slightly. The bottoming out and rebound of the US stock market was mainly due to Trump's withdrawal of some tariff policies.
Operational suggestions
Crude oil------sell near 63.00, target 60.00-57.00

Crude oil-----Buy near 65.00, target 62.30-60.00Crude oil market analysis:
Recently, crude oil has also fluctuated greatly due to the influence of fundamentals. It started to rise rapidly yesterday, and the daily line closed with a standard big hammer candle pattern. Today, we rely on the 65.20 position to buy. We can also consider buying when it falls back to a small support. Today's crude oil trend is bearish, and short-term buying and selling are both possible. The current fundamentals have basically not changed the selling of crude oil. In addition, there will be EIA crude oil inventory data tonight. Today's crude oil is expected to fluctuate greatly. Consider selling it when it rebounds to 65.00 in the Asian session.
Fundamental analysis:
Tariffs are the biggest fundamentals in the near future, and the market impact is relatively large. Today we focus on CPI data and crude oil inventory data.
Operation suggestions:
Crude oil-----Buy near 65.00, target 62.30-60.00

CL Swing Long Trade idea based on supply and demand, intermarket analysis and cross market valuation. Following a structured approach with clear entry, risk management, and confluence factors.

The quinquennial Bear Trap: Oil’s Next Leg DownIn this video I cover the potential for oil to trade down into the 55 $ range and what confluences we have at this price region .
Please support with a boost and I welcome any questions
