POLYGONBTC Reminds me of early ETHBTCA comparison between Polygon/matic (btc) and ETH(btc)
The structures are very similar
I have noticed also that both coins are primarily used in buying NFT's and other Internet items, further justifying the comparison
I have just bought some Polygon based on this comparison and the above assumption
MATICBTC trade ideas

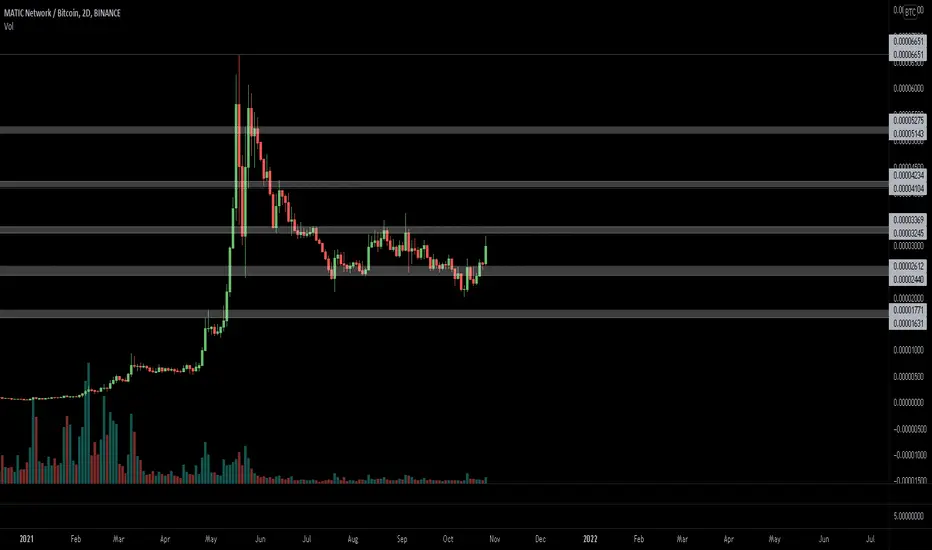
MATICBTC road ahead TA + FALet's assume a nice rally into the ZK conference and Vitalik talk.
Would take us up to the old ATH in sats (pink line) and roughly channel top.
Then a sell-the-news retrace to the mid-line before recovering and setting up for a nice C & H final moon rally.

MATIC BTC Parabolic RallyIs MATIC/BTC going parabolic?
Messed about on my phone for a few days doing this.

MATICBTCMATICBTC Printing an inverse head and shoulders
Should BTC pairs follow in the steps of ETHBTC ?
Entry is now.
STOP 0.000028.

MATIC BTCGann and channel analysis. Full send. The break-out will melt fleshl sinew and bone. From his fortress in Mumbai, the Great Eye of Sandeep sees all.

Matic may have found a short term bottom vs BTC short termNot running this one with large stakes, just play money here, up from 0.000026330-0.000027100-ish so far, restraining myself from a larger play this evening. But considering the downtrend meme-line has been broken with strength, someone with a bit more energy might see this as an opportunity. Also used RSI (which appeared to have bottomed out), also considering BTC had a short term top north by about 1.5K, which might logically mean, time for Alts to run a bit before BTC might take another leg up. Not using binance for the record here, but their chart is similar to the platform I am using.

MATIC/BTC Breaking H&S pattern!!!MATIC is breaking resistance around 3300sats on daily!!! Currently around 3550sats. If this hold today, suggest to buy on retest near the line on chart.

MATIC/BTC: A small double bottom at previous structureAfter the rally at the end of October, MATIC has come back down to test previous support, and does so with a small double bottom at a previous structure. This gives a good buying opportunity, as this structure is a perfect place to put stop losses below.
Disclaimer:
I am not a professional trader or investor. I post my ideas and analysis for fun only. This is not financial advice.


MATICBTCMetic is in a good position, it is possible to grow it to the historic level, but I dream of growing it to the level of 1.618 Fibonacci

MATICBTC Technical Analysis
⏳ Spot
💎 MATICBTC has formed a Bullish Flag. After the breakout it is expected that the price goes lower for a Pullback to retest the support zone before it continues the Bullish move
🌐 Tradingview
💵 Invest Only 5% of your Portfolio
🎳 Entry/Pullback now or from 0.00002730 to 0.00002448
☕️ TP1 0.00002979
🍺 TP2 0.00003390
🍻 TP3 0.00003824
🍾 TP4 0.00004225
🍷 TP5
🍸 TP6
🍹 TP7
🎁 TP8
🚫 SL 0.00002448 to 0.00002158
Good Luck 🎲
Check the Links in Description and if you LIKE this analysis, please support our page and Ideas by hitting the LIKE 👍 button. ❤️ Your Support is really appreciated! ❤️
Traders, if you have your own opinion about it, please write your own in the comment box. We will be glad for this.
Feel free to request any pair/instrument analysis or ask any questions in the comment section below.
We will have more FREE forecasts in TradingView soon
Have a profitable day 😊👍🏻

MATICBTC
MATICBTC
Enter @ 0.000026700
Target A 0.000036100 %23.19
Target B 0.000042100 %35.96%
BINANCE:MATICUSDT
BINANCE:MATICBTC

MATIC's Real break out is right around the corner $17 by EOY?Is a $116 billion market cap possible for MATIC? Why the hell no?
Regardless the breakout target out of this descending triangle is .00007228 MATIC/BTC. Assuming a $100k BTC, I think we should be able to see a $7 MATIC.
As you can see, we just retested and bounced off the diagonal line of resistance now turned support. I think we can be expecting some impulsive moves to the upside for MATIC in the coming month or two.
Hope you packed you bags!

Market RhymesNothing much to say. Chart says it all.
Looking forward for ultimate TARGET :D
Target : 0.0001

MATIC/BTC buy opportunityHi followers,
BINANCE:MATICBTC Bounced off support area, then formed higher low, which now suggests the possibility for a new big up move.
Don't forget to manage your risk! 👌
Good luck and trade with care 🙏
If you like my content - 👍 Like, 💬 comment, 👆 follow and 👉 share!
❗❗❗
Disclaimer: This information is not a recommendation to BUY or SELL. It is to be used for educational purposes only!


💡MATICBTC ANALYSIS💡Hello Friends
When we look at the chart daily, there is a shark bull formation.
It is very risky to enter the trade before the bulky momentum arrives. Risk money management is very important in such transactions.
There are technical levels on the chart.
TP1:0.00002811
TP2:0.00003600
Entry level to trade :0.00002291 (at 4 Hour candle close)
Stop los: 0.00001842 (Based on my own money management)
IT IS NOT INVESTMENT ADVICE. IF YOU
BENEFIT FROM ANALYSIS, DON'T FORGET
TO LIKE AND FOLLOW 👍👍👍👍 IF THERE IS SOMETHING WRONG WITH THE FORMATION, YOU CAN ALSO BE AWARE.
📗📗EDUCATIONAL PURPOSES📗📗
Shark Bull Formation ( Bullish Shark Pattern)
EU foot, OX foot on the 113% - from 161.8%
prolong BC feet, OXI foot of extending to beyond the far 113'ü% OX foot
BCR foot of the AX 161.8% - is an extension 224'lük%
OTHERS unlike harmonic patterns, operations are entered as follows: Targets can be 61.8% of BC with
incoming stops at 88.6% of the input OX leg and at point C

12% probable profit in MATIC/BTCIf this analysis goes well, there is a probability of about 12% profit, but you should note that this profit is distributed in 3 stages. So saving profit is very important.

$MATIC, Something to watch on Today's close..$MATIC
Something to watch on Today's close..
Still looking at a break above ~3400 sats (highest value since July)
UCTS signalling a potential 2D Buy signal
Set alerts and wait for it
#MATIC
Stellar - Polygon BridgeA Bridge between the Polygon and the Stellar chain would allow ERC 20 tokens to transact on the Stellar chain. Since USDC is an ERC 20 token and Stellar chain boasts sub 5 second transaction speeds this presents us with the perfect point of sale scaling solution for retail businesses.

Matic BTC 3dMatic has been consolidating against BTC for several months Is it time to break out ?
Matic retraced to the GP region of the pervious move and consolidated for some time.
We have started to see life in the volume.
We are pushing up against the trend line while also the RSI is trying to break above the 50 level
these are good signs of strength on a 3d.
ADX is going positive after a nice compression zone
+dmi is converging and trying to cross the -dmi
Already in this trade from deep but took more on the retest of the RSI on the daily as well.
=This is not trading advise.
I just draw lines and color them in.

Polygon vs Bitcoin Chart Analysis (MATICBTC #3)Formally known as MATIC Network, Polygon (MATICBTC) did some really amazing numbers.
We can see that in the first half of this year this pair grew over 12,200%. Wow.
After hitting a new All-Time High in May the correction has been going now for more than 5 months but it seems that there can be more.
The 0.618 Fib. retracement level has been taken out and we see a Doji forming right above EMA50, but the chart structure is showing potential for additional correction.
If MATICBTC can move and stay above 0.00002574 weekly, the bullish potential opens up.
Every day/week that passes below this level and we are looking at a stronger correction.
Around 0.00001466 which is where the 0.786 Fib. retracement level is sitting can be a good support, this also coincides with EMA100.
Strong/fast price appreciation can lead to long-lasting corrections.
See the chart above for additional information.
Wishing you a lovely weekend.
Wishing you great health, wealth, bliss, abundance, and infinite success.
Namaste.

MATIC/BTC AT KEY LEVELMATIC/BTC fell below the key level but it is reclaiming it, we can see a bullish OBV divergence on the 4H.
What i'd like to see now, remain above this level and start to show signs of a trend change / reversal.
