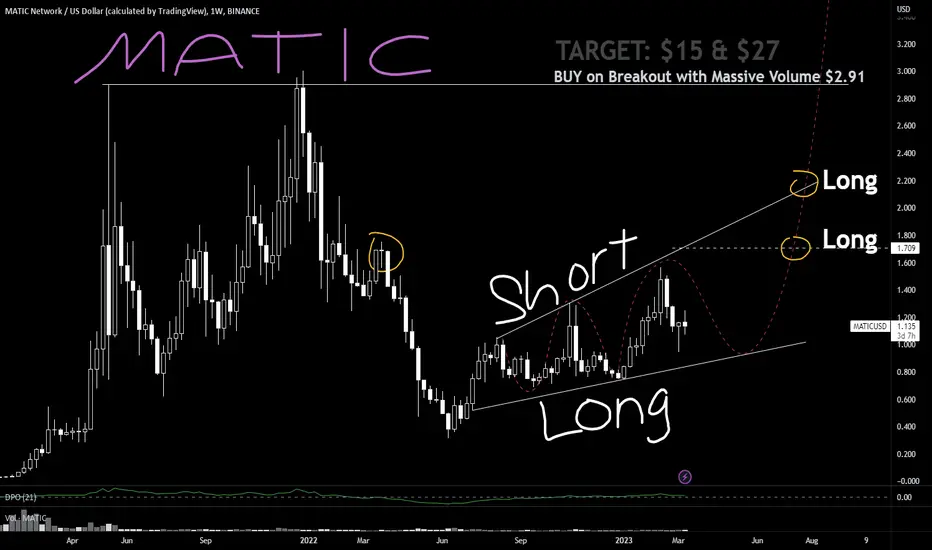
MATiC: Long Short PLAYBOOK
Indians love to churn businesses
so do projects with EXCELLENT marketing
as evident in MATiC price action anchored to series of camaigns
from Name Change POLYGON to recent zkEVM March rollout
Gang of 8 Whales control the Price
and looks like it loves to hunt stops in between the cost of HANDLER
Asian Market handler in control
Euro Market free for all organic market decides
US new york .. handler decides on news event driven anchored to BTC and DXY
Body Clock of Handler is it hunts liquidity at obvious floor ceiling beyond it
notice the TRUMPET formation
size you entry and Churn Milk this with the King of Japipur
NOTE:
do not use Logarithmic scale as it fools or tricks your eyes
stick to normal chart
that harami circled doji in Yello is an indecision or unfinished business of TRADE
to be revisited
MATICUSD trade ideas
MATIC - long positionMy fellow traders, MATIC chart is telling we can get a nice long position. Currently the price action is looking bullish. We can see a clear bullish divergence formed on 3D chart which lead to a break out of trend line. If we break a trend line to the upside I am looking to long Matic on retest. In case price breaks down I am looking to start building a spot position.
Targets and stop loss is indicated in chart.
Good luck.

MATICUSD This Double Bottom can finally break the WedgePolygon / MATICUSD is rallying off a Double Bottom but still remains inside a giant Falling Wedge pattern.
Double Bottoms are generally how big rallies start and this may be no different. Especially since the 1day RSI is on a Bullish Divergence.
This can break the Falling Wedge to the upside. Buy only after the break out and target the Fibonacci 2.0 level at 0.81000.
Follow us, like the idea and leave a comment below!!

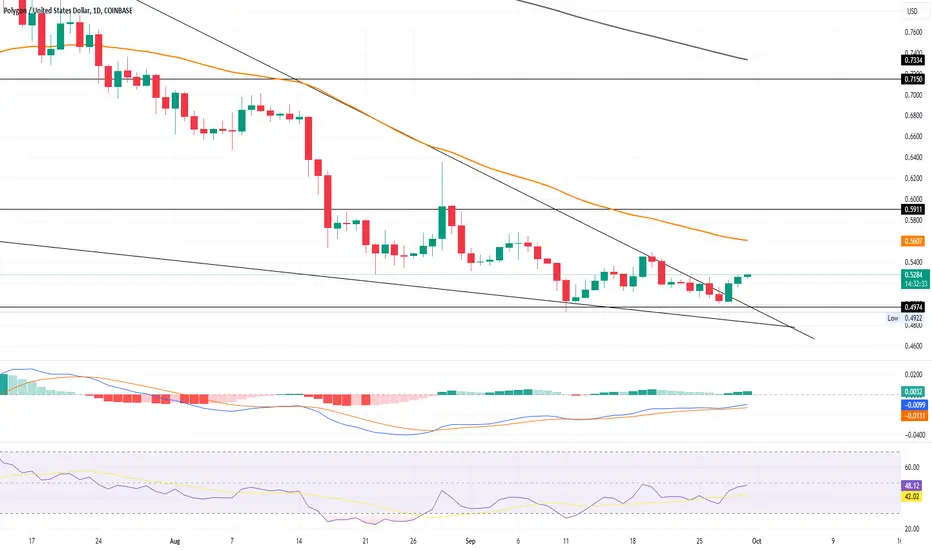
Will MATIC Price Reach The 200-day EMA?MATIC displays a bullish reversal with a falling wedge breakout.
The price faces resistance at the 50-day EMA and $0.5911.
A 25% price hike is expected, aiming for $0.71 close to the 200-day EMA.
Google Cloud's staking of 10,000 MATIC boosts positive sentiment.
Long-term correction in 2023 seems to be ending with a bullish momentum.
Crucial bullish support found at $0.49.
Double bottom reversal pattern observed.
Consecutive bullish candles for four days, accounting for a 13% jump.
Current trading price is $0.5618 with an intraday fall of 1.13%.
MACD line spikes higher, indicating bullish momentum.
RSI nearing the overbought boundary, signaling bullish strength.
Failure to sustain above the 50-day EMA could lead to a price retest at $0.52 or $0.50.

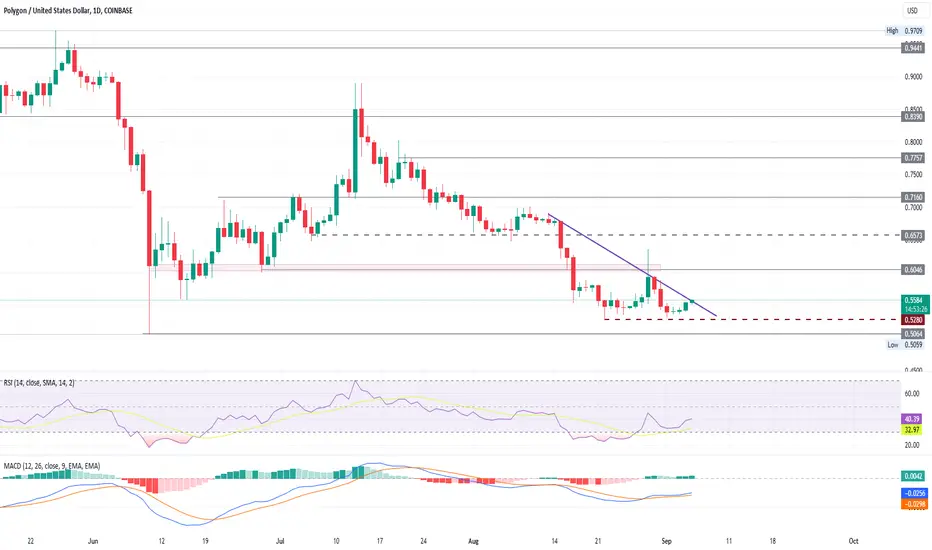
MATIC Price Analysis: MATIC Breaks Trendline, Hints 30% Hike!MATIC price action shows a potential bullish reversal.
The 50-day EMA has been a major resistance, keeping bullish growth in check.
A trendline breakout could unleash a new bullish rally.
MATIC has been in a long-term downtrend, leading to a death cross.
Recent support found at $0.49, teasing a potential reversal.
The price is currently trading at $0.52, with a 5.23% jump in the last two days.
A double bottom pattern is forming, signaling a potential trend reversal.
A morning star pattern has also formed, adding to bullish indicators.
MACD and signal lines avoid a bearish crossover, indicating bullish momentum.
RSI struggles to break above the halfway mark but remains above the 14-day SMA.
Upcoming resistance levels are at $0.59 and $0.71.
Failure to sustain the uptrend could see the price drop to $0.42.
MATIC - Buy AreasIf you are not buying magic now at 0.5 I dont know when you plan to start. Two shaded areas are buy levels for Matic, this project will not die.

Solid Buyers At $0.50 Eyes A Jump To $0.75!MATIC price action shows a falling channel pattern.
50-day EMA is keeping bullish growth in check.
Trendline breakout could unleash a new bullish rally.
MATIC has lost 67% of its value in the last 8 months.
Strong support found at the psychological mark of $0.50.
MATIC is under extreme bearish pressure.
Strong demand at $0.50 is challenging the trendline.
MATIC is trading at $0.5203 with a 1.15% growth in the last 24 hours.
MACD and signal lines avoid a negative crossover.
RSI maintains above the 14-day SMA but struggles to rise.
Bullish divergence is seen in the daily-RSI.
A breakout could push MATIC to $0.74, while a slide under $0.50 could lead to $0.40.

MATIC Breakin Support Target Area'sBreakin 200MA around $1 could lead to the bottom of wedge $0,8 and a Support 0f $0,75.
Breakin the up stated Support areas and the next drop lead to the Wedge Target around $0,4 $0,30 (also Fibonacci Target's)

Bearish ContinuationDear Trader,
I trust you're doing alright.
MATICUSD has broken out of the rectangle range. The current bias is bearish as the most recent price action is a break below the resistance level. We thus expect the price to continue downwards.
On the other hand, if the price should trade above the trendline resistance and break the current static resistance level, this would change our bias to bullish.
Dear trader, what is your thought on MATICUSD?
Kindly like and comment below.


Bearish ContinuationDear Trader,
I trust you're doing alright.
MATICUSD is currently trading within a rectangle range. The current bias is bearish as the most recent price action is a break below the resistance level. We thus expect the price to continue downwards.
On the other hand, if the price should trade above the trendline resistance and break the current static resistance level, this would change our bias to bullish.
Dear trader, what is your thought on MATICUSD?
Kindly like and comment below.

MATIC price is currently facing a bearish trend, challenging theMATIC price is currently facing a bearish trend, challenging the $0.50 support level.
The crucial EMAs in the MATIC price chart are bearishly aligned.
A breakdown below $0.50 could lead the MATIC price to drop to $0.45.
Despite Bitcoin's potential comeback, MATIC struggles to tap into the bullish momentum.
MATIC price shows a falling wedge pattern, which typically indicates a potential bullish reversal.
The daily chart reveals a falling channel pattern with a 66% correction over the past seven months.
A breakout from this trend could push MATIC towards the $0.60 mark, but a breakdown could lead to prices of $0.48 and $0.45.

MATIC will go back to 0.4569 will it?BINANCE:MATICUSDT will go back to 0.4569 will it?
Because the chart has seen a breakout of the 0.5061 area, so for the next demand, it will return to 0.4569 and if it is not strong in the demand area, it will drop back to the 0.3441 area.
good luck everyone!

Can the $0.52 Support Propel MATIC's Next Rally?MATIC price rebounds from the $0.52 mark.
The current rally is testing the short-term resistance trendline.
A successful trendline breakout could propel MATIC towards $0.60.
Year-to-Date, MATIC has dropped by 25%, trading at a significant 64% discount from its 2023 peak of $1.56.
Polygon (MATIC) finds strong support at $0.52, preventing a further decline to $0.50.
A demand zone is forming at $0.52, hinting at a double bottom reversal with a target at the $0.62 resistance.
MATIC forms a morning star pattern at $0.52 and has risen by 2.59%.
The price action at $0.52 suggests a higher likelihood of a breakout.
The 4-hour chart reveals a descending triangle pattern for MATIC.
Technical indicators, including MACD and RSI, are bullish.
A breakout above $0.60 could set MATIC on a path to $0.80.
A bearish turn threatens the $0.52 support, with potential drops to $0.48 and $0.45.
MATIC Support retest or chain baiting?Large influx of matic to exchanges. Multiple aggregated transactions to exchange without any withdraws in the past few hours.
$0.30 Matic is a optimal long term entry.
NFA

A short term pump the a dooms day!Matic on weekly showing a very weak chart. The The3eyedScalp indicator is turned red as well as the trend has been broken already.

Trapped In A Triangle MATIC Prices Are At Crossroads!MATIC price action shows a sharp decline, leading to the formation of a triangle pattern.
A potential breakdown could see MATIC prices fall below $0.50 to $0.4480.
Conversely, a bullish reversal might propel MATIC prices to $0.70.
Polygon's price has found support at $0.53, hinting at a short recovery.
The upcoming Bitcoin ETF's SEC deadline might bring a bullish spike for altcoins.
MATIC's price action within the 4-hour chart forms a triangle pattern due to the resistance trendline.
Despite crashing to the triangle's support trendline, MATIC prices have held firm.
A potential positive cycle could see MATIC prices rise within the triangle.
However, the recent 7.72% drop in 48 hours suggests a possible downtrend for Polygon below $0.50.
Technical indicators like MACD and RSI show a bearish trend in the 4-hour chart, with the declining 50 and 200-day EMA reinforcing this sentiment.
MATIC's price is trapped in a triangle, indicating a potential sharp move upon breakout.
A bearish breakdown could push MATIC prices to $0.4480, while a bullish breakout might see prices nearing the $0.70 mark.

Web3 is Just Getting Started - Probably Around NowBeen noticing that the quality of feeds in my crypto stuff has improved recently. I think most of the grifters have left so there's a much higher chance to see the builders out there now.
Kind of depends when you got in of course, but this winter is pretty much the same "flatline" that it has always been. It goes up, then it goes down. Usually back to where it started, plus or minus a few percent. As long as it doesn't go below where it used to be, though, there is always another chance to pop off.
All I know is that people who got in during the hype (including myself) lost money, sometimes a lot. Those who stuck with it during times like these made money - sometimes a lot. It's simple, but also pretty difficult - it's only human to want to follow the hype, after all.

$MATIC long to $4.46?CRYPTOCAP:MATIC looks to be bottoming and forming a wedge on HTF. If this breaks up, I think it's likely that the upper target of $4.46 could get hit.
Let's see how it plays out.

✴️ Polygon Is Ultra Bullish, I'll Explain Why...Rather than publishing this I should be working on a trade signal for my people, because this is a really strong pair/chart.
Its been a while since we last looked at Polygon, MATICUSD.
The chart is easy to read.
✔️ Short-term, we have a double bullish divergence, MATICUSD vs RSI & MACD.
✔️ Long-term, we have a very strong higher low forming a big ascending channel.
These two signals put together, the higher low ascending channel with the short-term bullish divergence confirms what happens next.
As the long correction is over, a higher high follows and this can go for 1 to 3 months... That's green, green, green all the way.
Now I have to work on the trade.
Enjoy your week.
Sending you positive vibes.
Thanks a lot for reading and for your continued support.
Namaste.

Matic Looks Ripe for a Bounce/Break HereTraders,
Just browsing through the charts this morning and thought I'd throw out a trade opportunity. There are many but Matic looks especially juicy here. Of course, it's always a bit risky before a FED meeting/press conference (i.e.- Jackson Hole) but I am not offering trading advice. I just wanted to show you one of the many opportunities I have spotted this morning.
Here's the case for entry here if you are so inclined:
- That Yellow TL comes all the way from Jan. '21. It has NEVER been broken to the downside.
- Price rarely touches this level on the RSI. Even more rare, would be a break below.
Probability stands on the long side here.
Best,
Stew

MATIC on WeeklyI don't think I have to say anything on this, the image is quite clear and once the price reaches the long term support, it will be a great buying opportunity.

