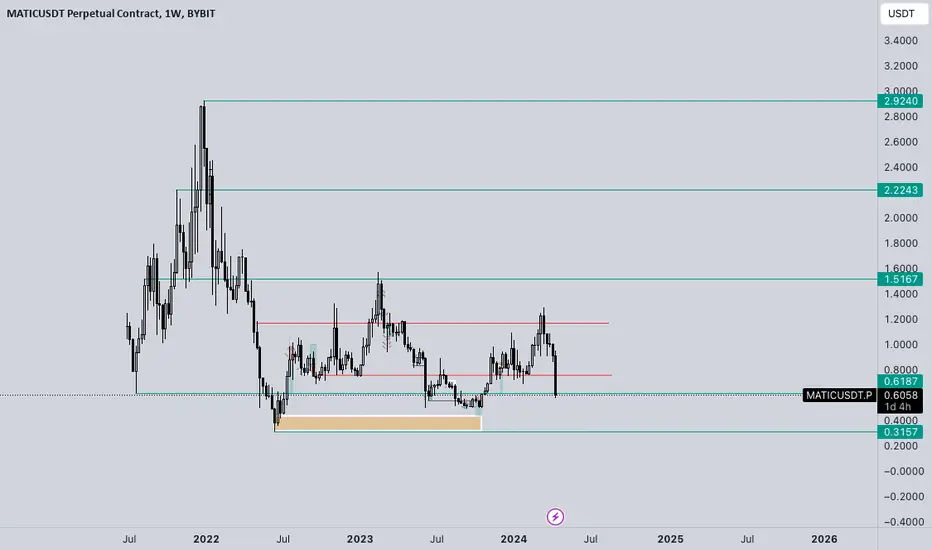
MATICUSDT.PHello Trader BINANCE:MATICUSDT.P
1-day strong bounce area support in the 0.6033 area confirms the reversal to bullish, and there is a bright spot at the moment for automatic pairs, it can be at the market price or buy limit area 0.7175
take profit 25%
stop loss 4%
Please add a comment and Positive feedback and constructive criticism are important to authors and the community.
Disclamer: Not Financial Advice
MATICUST trade ideas

MaticusdtMatic usdt is ready to turn and will target 2.4 $ mark, once that's taken out, it will target a new all time high.
Entry - 0.72
SL - 0.41$
Target 1 - 1.9$
Target - 2 - 2.4$
Target - 3 - 3$

I Think MATICUSDT Will Breakout SoonA large triangle can be obtained using previous highs.
MATIC is testing the trend line for the third significant time.
I think this trend line will be broken and MATIC will break out upwards
I'm very bullish
I think of MATICs chart as ETHs was in its early days

$MATIC 's chart looks bearish in mid term#MATIC #POLYGON 's long term bearish channel continues.Tried a fake out 1 month ago but the price 1.30 #usdt declined at top of the channel.With this weakening, retraces to mid of the channel is necessary, this means at least 1/2 of the price.If news emerge and break 1 #usd again, that is the invalidation of this scenario. Not financial advice.

🔥 MATIC On Bear Market Support: Big Reversal Coming?With BTC trading bearish over the last few weeks, alts have taken a big hit. MATIC is one of the alts who has practially lost all the gains over the last half year in a matter of weeks.
However, MATIC has found support on the main bear market support (purple). This signal is based on the idea that the support will hold and that both alts and BTC will reverse from extreme oversold conditions.
Stop below the recent low, target at the main bearmarket top.

Matichell , oo ,
well, matic, simple minds.
i want to collect all the evidence before the final act.
the film was not over yet.
Matic will do 70x
how i know this? because i see the future.
3$ Minimum for this Bullun

Buying some matic at this level I a, buying some matic as a low risk altcoin . Supports and resistance are clear .

Matic the Final Short before Full BULLCame Back after a long Break. The break was worth it.(The Alts Nuke was kinda Unexpected)
Will be shorting Matic 0.7550 above.
I think it can go down about 10-23% before turning the trend.
targeting 0.6900 and 0.6600.
Stoploss above 0.7650.
Not: Not a Financial Advice.

✴️ We Are Looking Awesome Long-Term | Polygon To $7.65While Polygon is sure to take part in the first 2024 Cryptocurrency marketwide correction, this is only a short-term move.
Short to mid-term to be more specific as this correction can extend and about this we will know more pretty soon.
Polygon has been growing long-term, it is surely an amazing project.
Cryptocurrency as a whole is something unique; a perfect technology for us now, for the information age (Aquarius).
The bear-market bottom low for MATICUSDT happened June 2022, which matches the orthodox end of the bear market for Bitcoin and most of the major Altcoins.
Drawing a trendline from this major market low and passing through Sept. & Oct. 2023 we can get a trendline support. This can be the correction low, potentially a long-term higher low.
You know in this channel we look at the charts not only as trading opportunities but also for learning. I try my best to explain the signals and market conditions together with the overall market picture.
Being aware of the long-term possibilities of a trading pair is a great way to avoid panic when prices are going down; it is an amazing way to be prepared.
Knowing that Polygon going down is only temporary can help you to stay strong, hold strong or it can help you sell to buy back lower; whatever you do is your choice.
There is a trick with selling and buying back lower.
➖ We can't predict with exactitude the next bottom/low/support.
➖ Market psychology can lead to selling the bottom rather than buying, so a plan is needed to make the most of information like this one.
Regardless of what happens in the short to mid-term, MATICUSDT is set to grow long-term.
➖ 2024 will be an amazing year for Cryptocurrency.
➖ 2025 will be more than great.
👉 We are looking at $7.65 as a new All-Time High —in the vicinity of this price, it can vary wildly.
I see a stop around $2.2222 on the way up with other important points that we will visit and study once the next bullish move shows up.
I appreciate your time.
I appreciate your consideration.
I appreciate you always reading.
Thanks a lot for your continued support.
Namaste.
📈MATIC Analysis: Key Support Area⚡️🔍Today, our focus is on MATIC, which finds itself on a significant support level in the 4-hour timeframe, presenting a vital opportunity for its progress path.
☢️Following the Iran-Israel conflict news, the entire market experienced sharp declines, leading to a more rational market condition. The previous sharp wave corrected to the 0.382 Fibonacci level, and currently, with the breach of $0.6449, we could anticipate another downward movement.
📊Red candle volumes continue to surpass green candles, confirming the downtrend. Additionally, the SMA25 indicator approaching the price could potentially drive it downwards, serving as validation for the continuation of the trend. If SMA25 fails to exert downward pressure, the market may enter a range until SMA99 aligns with the price.
📉The short trigger lies at $0.6449, coinciding with the support breach, validating the Fibonacci continuation level as a good entry point. Simultaneously, if the RSI closes below 34.25, it further confirms the entry, providing additional confidence.
📈For long positions, a trigger at $0.7491 could be suitable, requiring at least one price reaction to establish a higher low. In such a scenario, the price has returned from the 0.382 level but failed to breach the main support, indicating seller exhaustion.
🧠💼It's important to acknowledge the inherent risks in futures trading, with the potential for margin calls if risk management is neglected. Always adhere to strict capital management principles and utilize stop-loss orders, ensuring that the initial target offers a risk-to-reward ratio of 2

MATIC at 0.886 Fib spot buying zone! 🌐 Potential for 3x gains "🔍 MATIC is currently at a critical level, sitting at the 0.886 Fibonacci retracement zone, a historically strong support area. 📊 This level often indicates a reversal point in the price action. 🔄 Additionally, we're seeing promising signs of accumulation, suggesting strong buying interest.
💡 For traders looking to capitalize on this setup, spot buying at this zone could be strategic. 🎯 With the potential for a 3x increase in value, there's a clear opportunity for significant gains. 🚀
🔥 As always, it's crucial to consider risk management strategies, such as setting stop losses to protect against unexpected market moves. 💪 Stay tuned for potential breakout targets and updates! 💼 #MATIC #Crypto"

MATICUSDTMATICUSDT
i can see triangle on wave 4 the main wave
we are in last wave 5
you can enter the market exactly with given signal with risk management

MATIC - Good or Evil?I don't have a position in MATIC although I might have one soon. It is just interesting to me as a chart.
Bearish argument: It's a really wicked redistribution.
Bullish argument: It's something like a bullish rectangle.


MATICUSDTWe will attempt to buy MATICUSDT at breakout of LH by placing buy stop (also HL , Bullish divergence occur indicate that it will move upward).
SL , TP mention in chart.

MATIC/USDT buy Possible buy
Matic / usdt ....
Good pump from weekly imb/fvg
Very good confirmation of 1h and 2h
10% profit target is possible from here .....

MATICUSDT 1DWe have a bullish Megaphone pattern on the #MATIC daily chart, which is promising. If you want to enter this setup, use stop-loss. Because Bitcoin can ruin the party at any moment. Targets are:
$0.8307
$0.9169
$0.9866
$1.0562
$1.1554
$1.2818
$1.4424
$1.5263

MATICUSDT Elliott Waves (Inestment Idea)Hello friends.
Please support my work by clicking the LIKE button👍(If you liked). Also i will appreciate for ur activity. Thank you!
Everything on the chart. (update)
Almost nothing has changed from my last idea, price went by alternative option, continuation of growth is relevant.
Targets: 3 - 5 - 9
Main(investment) target zone: 9 - 12$
Cancellation of setup - decreasing under ~0.5
It's not financial advice.
DYOR!

MATIC IS READY FOR FIFTH ROUND OF BULLISH WAVEMATIC might have been completed 4th wave of downtrend inside triangle pattern. We need the price to stay above 0.52 level in order to be bullish. Soon it is expected to catch bullish momentum once BTC melting stops.

MATIC - Ranges overview We are currently trading below the lows of the HTF range (red lines) on MATIC.
Let's see IF BTC hold its lows and manages to hold the overall crypto market.
IF we fail to hold these levels on MATIC we should hunt the sellside liquidity resting around 0.4000$
IF we hold these levels expect us to aggressively run the buyside liquidity.
Don't try and FRONT RUN THE MARKET
LET THE MARKET SHOW YOU ITS HAND AND REACT TO IT
Stay safe and never risk more than 1-5% of your capital per trade. The following analysis is merely a price action based analysis and does not constitute financial advice in any form.
MATIC X2 PotentialMatic has been in the bull cycle from 2021 and so a correction this massive was expected. Good entry point is 0.5 as that is the resistance on the Day time frame using the Fibonacci sequence.


Just bought into MATIC during the dip for my long-term portfolioJust bought into Matic during the dip for my long-term spot portfolio. Excited to see where this gem takes us! 💎
