MATIC - A Beautiful Rising ABC Jumping Though The CreekCRYPTOCAP:MATIC
From the bottom we've watched a Wyckoff Accumulation jump the creek and stair step through a 5 Elliot's Wave and print a rising ABC flag, while coiling on support and showing a SOS at the LPS all while printing a large daily bullish OBV divergence.
Matic has always been a slingshot play, this lag in PA is exactly what was needed to shakeout the weak prior to vertical IMO
MATICUST trade ideas

#maticusdtThis is my opinion regarding this currency, according to the failure of the long-term trend line and the existing support.
entry : /8066
tp1:1.8

MATIC long hereHi Im taking Matic here - monhtly deviation hasnt been confirmed (yet) thus smaller position and will cut fast if it goes against me...
fresh breakoutMatic has been stuck in a triangle since 2021. now in 2024 we have a FRESH breakout + retest.
check. and check.
Bullish if we can hold above triangle for the rest of the month.
Monthly candles have a very interesting higher low as well.

Matic Fractals : Range => Shakeout => PUMP !!!MATIC has been exhibiting a peculiar pattern on the daily timeframe. The price has been accumulating lows twice now, followed by a sharp shakeout of those lows (liquidity grab), which then triggers a pump. This article will focus on the idea that history repeats itself in the market and how we can capitalize on this by identifying these patterns.
The accumulation and shakeout:
MATIC formed clear patterns of accumulation. In both cases, the price consolidated within a range for a few days, creating a cluster of lows. This was followed by a sharp downward movement, shaking out weak hands and stop-loss orders, which is a common market manipulation tactic known as a "liquidity grab."
The pump:
After the shakeout, MATIC bulls stepped in and started buying, resulting in a strong bullish rally. In the first instance, the price rallied from $0.80 to $1.20, a 50% increase. In the second instance, the price rallied from $1.00 to $1.60, a 60% increase.
History repeats itself:
The saying "history repeats itself" is often used in the financial markets, and this is a perfect example. MATIC has shown us a clear pattern of accumulation, shakeout, and pump twice in the past. It is reasonable to expect that this pattern could repeat itself in the future.
The opportunity:
The current price of MATIC is sitting at a critical support level. If the price breaks down below this level, it could invalidate the bullish thesis. However, if the price holds and starts to accumulate lows again, we could see a similar bullish rally to the ones we have seen in the past.
The trade:
If you believe that history will repeat itself, you could enter a long trade on MATIC once the price confirms a breakout above the current resistance level. A stop-loss order could be placed below the support level to mitigate risk.
Conclusion:
The MATIC chart shows a bullish pattern. The price has been accumulating lows and shaking out weak hands. This has happened twice in the past, and both times it was followed by a strong bullish rally. If history repeats itself, we could see a similar rally in the near future. However, traders should always do their own research and manage their risk accordingly.

Polygon (MATICUSD): Time To Blow Expectations!Polygon (MATICUSD): BINANCE:MATICUSDT
For Matic, it is now assumed that we have developed the first Wave (a) around our 50% level at just under 90 cents. Now, we're working on developing Wave (b), which is currently at the 138% level and at the end of our resistance zone. This zone has been significant in several instances, holding up so far, and indications suggest it continues to hold. If we surpass this 138% level, it would imply that our limit order, or rather Wave ((ii)), has been reached, concluding this phase and entering Wave ((iii)). If this doesn't happen, we continue to expect a sell-off down to the 50% level, and at most to the 78.6% level.

MATIC/USDT assessing key support? 👀🚀Polygon analysis💎 Paradisers, pay close attention to #MATICUSDT. It’s currently displaying a promising sign of an upward trend, having recently broken above its descending trendline. This sets the stage for a potential bullish move
💎 Historically, #POLYGON has adhered to a descending channel pattern, consistently showing lower lows and lower highs. At present, it’s positioned at a crucial support level of $0.9296. If the price maintains its momentum here, we’re on the brink of a significant bullish surge.
💎 As prudent traders, we must be prepared for various outcomes. While a bullish rebound from a lower support level at $0.8335 remains a possibility, dipping below this level could trigger a marked bearish downturn.
💎 Keep your strategies versatile and your decisions well-informed, Ladies and Gentlemen of ParadiseClub. Your ParadiseTeam is diligently monitoring the market to navigate these opportunities effectively
MyCryptoParadise
iFeel the success🌴

#MATIC/USDT#MATIC
The price is moving in a downward channel on a 4-hour frame and we have a green support area at the 1.00 level
We have a higher stability moving average of 100
We have a good bounce being set up from the lower border of the channel
The RSI indicator has a downtrend that is about to break higher
Entry price 1.08
The first goal is 1.12
The second goal is 1.20
Third goal 1.29

MATIC ANALYSIS🔮 #MATIC Analysis - Breakout 🚀🚀
💲💲 There is a breakout of Falling Wedge Pattern in #MATIC and trying to retests the level. It's a 4 hr time frame breakout and we will see more higher price in short-term. A successful retest of support could propel a rally 📈📈
💸Current Price -- $0.9388
📈Target Price -- $1.2702
⁉️ What to do?
- We have marked crucial levels in the chart . We can trade according to the chart and make some profits. 🚀💸
#MATIC #Cryptocurrency #Breakout #DYOR

#MATIC/USDT#MATIC
The price is moving in a downward channel on a 4-hour frame, about to break upward
The area in green is a very strong support area from which the price rebounded at 0.8500
We have a downtrend on the RSI indicator about to occur. The fraction is up
We have a higher stability moving average of 100
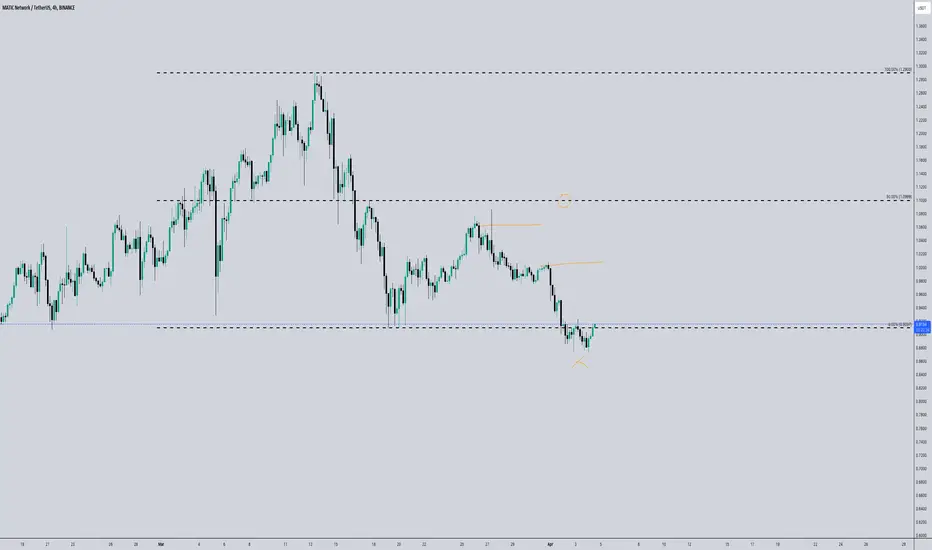
Entry price. 0.9105
The first target is 0.9635
The second goal is 1.019
the third goal is 1.085

Matic/Usdt Plan MATIC/USDT appears to be gearing up for a breakout on the 4-hour time frame. In the event of a successful breakout, we could potentially see a bullish rally of 30-40% in the short term. I anticipate this breakout to occur soon, but it is important to wait for confirmation before taking any trading actions. Please note that this is not financial advice, and it is always recommended to conduct your own research (DYOR) before making any investment decisions.

#MATIC/USDT is testing the Diagonal Trendline in 4-Hour TF!#MATIC/USDT is testing the Diagonal Trendline in 4-Hour TF!
CRYPTOCAP:MATIC is trying to breaks PML $0.909 resistance level. We needs a candle closing above this. Wait for trendline breakout and retest to long #MATICUSDT.

MATIC is getting ready for a significant move!Hi All,
Polygon (MATIC) is a significant blockchain project focused on Scalability and Efficiency . It enables faster, low-fee transactions within blockchain networks. As a top cryptocurrency, MATIC has recently undergone a healthy correction and is poised for a crucial move. Keep in mind that this coin requires a Mid or Longer time frame for substantial profits.
Currently, MATIC is forming a compelling triangle pattern after a substantial decline and correction. This compression suggests an imminent breakout, with a strong possibility of reaching a price target around $2.
Note: A well-timed move could even push and propel it to $3 or higher!
What do you think? has potential for 100% Profit you think? 🚀
Good luck! 🎯
Armin-Academy

MATIC Polygon Consolidation AreaFollowing MATIC's precise entry into the Buy Area:
At present, I anticipate trading within a range, awaiting price consolidation around $0.95 before witnessing another significant move.

MATICUSDT.PHello Trader BINANCE:MATICUSDT.P
It's very difficult to take this position, but I'm sure it will break down for a while.
take profit 7%
stop loss 2%
Please add a comment and Positive feedback and constructive criticism are important to authors and the community.
Disclamer: Not Financial Advice

MATIC - will there be further increases?Altcoins with small capitalization (young/new) have already made huge increases in the bull market, and what about altcoins with larger capitalization? The boom doesn't apply to them? I present to you possible growth scenarios with potential key places for continued growth. The first scenario assumes increases after repeating the 1:1 black correction, i.e. wave 2 as wave 4. The condition is that the price will rise above 1.54usdt. The second scenario is a flat ABC correction, where the condition is that the price increases to the red zone without breaking the top of wave 1 and falls to the green zone as wave C, ending the correction, after which I assume increases. Regards.

MATICUSDT - Declining PhaseMATICUSDT in Declining Phase with Bearish Candlestick Patterns indicating continuation of bearish trend.
Matic To 0.949 🚀💲Matic take Imbalance in : 0.8606
and it's ready to go up at anytime
maybe it go down more to 0.8553 , and going up again
targets 🎯 :
1 - to 0.8949
2- to 0.9249
PS : Use 5 Min TimeZone and 2 Hours TimeZone
to see chart more clear

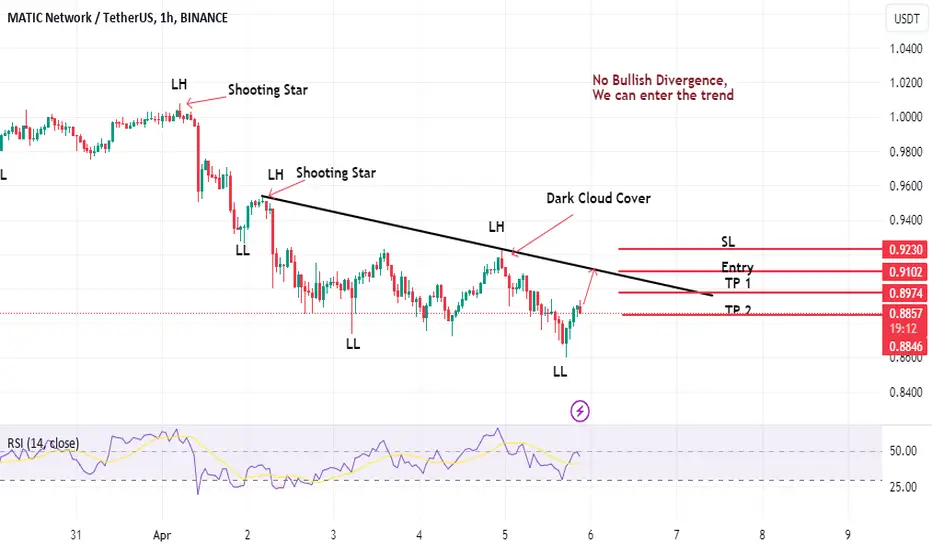
MATIC/USDT shortMATIC/USDT short term targets are mentioned on chart. I personally took this trade and shorted MATIC/USDT from 0.9200,
Bearish RSI divergence, Resistance at 0.9200 are the key factors on which I shorted MATIC.
Always manage your risks when taking trades.

Matic looks bullish Matic looks bullish after completing the correction period, currently trading at a demand zone.

strong buyIt is quite clear that this pattern is a flag .
The whole market is rising, but MATIC has not started yet .
It can be a good start for those who haven't bought anything yet.
good luck

MATICUSDTA higher timeframe breakout and restest by Matic. Finding support at range POC. AVWAP from the low and fib golden pocket.
A long trade any day off the week.
Remember correct R:R. Not financial advice.

MATICUSDT 3D#MATIC broke the trend line and retested it on the 3-day chart. The Golden Cross happened. We expect some good upward movement from here. Targets are:
$1.1595
$1.4200
$1.6805
$2.0515
$2.5240
Support is around $0.8371
Buy a bag and hold.
