$MATIC BULL RUN ROADMAP Toward $15CRYPTOCAP:MATIC BULL RUN ROADMAP
1⃣ #MATIC Forming Bullish Pennant In HTF
2⃣ 2021 Bull Run: Did 100x in Last bull Market After Bull Flag Breakout
3⃣ If MATIC/USDT Break $1.20 Level in HTF then Ready for $10-$15 Target
4⃣ I am Bullish in #POLYGON for Long Run
5⃣ If Market Crash then Best Accumulation Zone will be $0.60-$0.70
MATICUST trade ideas

MATIC to the MoonPolygon (previously Matic Network) is the first well-structured, easy-to-use platform for Ethereum scaling and infrastructure development. Its core component is Polygon SDK, a modular, flexible framework that supports building multiple types of applications.
To learn more about this project, check out our deep dive of Polygon Matic.


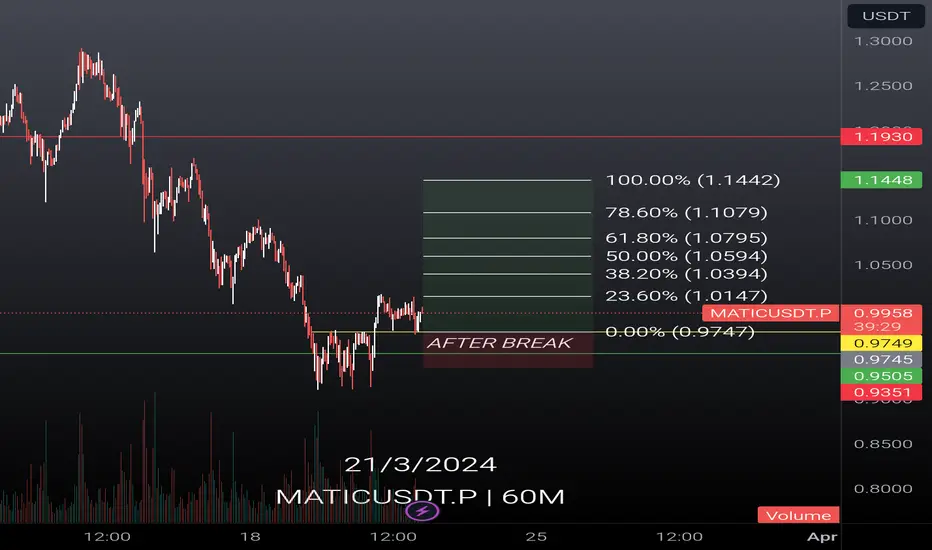
MATICUSDT.PHello Trader BINANCE:MATICUSDT.P
the green line is the weekly area for this matic pair, because of the confirmation of the weekly area bounce, the benchmark for taking small time frame scalping areas in 1 hour.
after the yellow beak line it can be a benchmark for a small support area. can be limited to the area, it is possible to retest again because it is possible to go up after the bitcoin correction.
take profit 17%
stop loss 4%
Please add a comment and Positive feedback and constructive criticism are important to authors and the community.
Disclamer: Not Financial Advice
ADAM & EVE DOUBLE BOTTOM 🔥🔥🔥🔥🔥
Spicy W formation on the weekly.
Gotta be patient with this one and hope it does not reject of $1.30 again

$MATIC IS READY TO BREAK OUTBe aware we can still have drawbacks in price but after breaking out we look amazing

matic pt.2 🍒last post from 2022:
---
dear anon,
i write to you from a triangle which i am currently trapped in.
my name is matic, and i'ma hit 10 cents within the next year.
---
they call me a sharp zig-zag,
which is sub-divided into a 5-3-5,
with a triangle for the b wave.
the triangle is not yet visible,
but it will be as the months progress.
i'm invalid if i sweep the all time high,
in which case, i will speak again.
🍒

Maticusdt{ Beast released here}I will swing my position here..matic is still great project and soon will explode .one of my bigger portfolia.. stay patience .

Matic Network I believe the yellow line marks the end of this downward movement, indicating the beginning of a new short-term uptrend within the broader upward trend


MATIC Liquidation HeatmapMATIC
short Liquidation
1.1794
1.3068
if there short squeeze
there is 2 price

MATIC: Respecting the resistance trendline!Over the past three years, the price has been following the resistance trendline, and recently, it tested the trendline, but it was unsuccessful in breaking through. If the price does manage to break through the trendline in the near future due to BTC going to higher highs, it is likely to move towards the blue resistance zone.
However, the price is currently heading towards the strong support zone, and the overall direction ultimately depends on where BTC goes from its current level. Hence, it is prudent to keep a close eye on BTC and its movement!

MATICUSDT to hit weekly support zone before bounceThe price was rejected from monthly resistance MR1 and currently it is trading between monthly resistance MR1 and weekly support WS1. The price had reached MR1 zone after trading for a longer period around WS1 zone. I believe, the likelihood of the price hitting this weekly support zone WS1 is high. This will allow the price to bounce again from that zone. This bounce may allow the price to aim for the MR1 zone again.

#MATIC/USDT#MATIC
The price recently reached the first target of 0.8400, which is a moving average of 100 on
a 3-day frame
It achieved approximately 70% rise
After the descending triangle and the downtrend were broken, which opened the way for the rise
Supported by saturation on MACD
It is expected that a slight correction will occur before the rise to the second target at 1.1400 continues
Then the second target is 1.4446
This represents 300% since the downward trend was broken

Matic is getting ready to new ATHHello SSE community
As you can see #MATIC in it's USDT pair is getting ready to retest the long-term dynamic support and if it holds that gonna be good entry point into matic for bull-run
Good points as entry trigger : 0.90 , 0.86
Enjoy and lucky with your investment

Will matic surprise us again?Hello hello.
Matic chart sounds luring.
In monthly time-frame we can see 2 gorgeous things:
1-A bullish flag.
2-The long-term support.
I guess it's worth giving some thoughts to.

short MATICMATIC broke through the support level and the ascending trendline. Decline to support level at $0.91 is expected to happen.

Cryptolean Chainlink MATIC Update Polygon MATIC declined sharply to $1.01, the key daily support.
A bullish reversal from $1.01 is likely and will result in a bullish move to re-test $1.07 and the key daily resistance zone of $1.14-$1.20.
A bearish break-out of $1.01 will push #MATIC price in the daily range zone and will increase probability of a deeper correction towards the next support at $0.89.
Intraday Chart
The MATICUSDT 4-Hour chart is bearish and teasing the resistance at $1.07.
A bearish rejection of $1.07 will lead to $1.01 and lower to the key support zone of $0.86-$0.92, where I will be closely watching the MATIC price action, as the bullish rejection of this zone is possible.
A bullish break-out of $1.07 will lead to a re-test of $1.13 and, possibly, $1.19, however the price action may be slow and choppy.
Support once read!
Thank you.

MATIC - TIME FOR EXHAUST?The asset broke out of the symmetrical triangle pattern.
Sticking with established patterns, the initial liquidation target is forecast at 1.5642.
The identified strong support zone is between 1.1 and 0.96.
In the immediate area, the nearest resistance zone extends from 1.35 to 1.5.
A potential struggle is expected in this range, which is likely to lead to subsequent liquidation (x), followed by a local correction.
The prospects seem promising; let's remain optimistic.

Fly of maticHum,btc is on a good level and maybe let us to have a small risck on matic,I long it with a good stop,be on your plane, it's my idea and maybe false

Polygon MATIC ABC AnalysisI could be wrong but it is a possible possibility. Remember everything is still cheap

MATIC/USDT can beIt is retesting its support and a monir fall can trigger liquidity after which we can see a pump above 1.2 entry should now market price 1.1058
