$MATIC Tripple bottom Head & Shoulders Reversal CRYPTOCAP:MATIC Polygon is retesting a breakout above the downward channel since December. It appears the recent low of $.7650 is a potential higher low from the bottom at $.69. The next level to test as support is $.7777. Then CRYPTOCAP:MATIC needs to get above $.8056 to continue it's breakout to $.88, $.93, $1.00+++
Do your own research. Just ideas.
MATICUST trade ideas

MATIC ANALYSIS🔮 #MATIC Analysis - Breakout 🚀🚀
💲💲 There is a breakout of Falling Wedge Pattern in #MATIC and trying to retests the level. It's a 4hr time frame breakout and we can see more higher price in long-term. If the price closes above the major support then there will be a confirmation of bullish movement 📈📈
💸Current Price -- $0.7892
📈Target Price -- $1.0597
⁉️ What to do?
- We have marked crucial levels in the chart . We can trade according to the chart and make some profits. 🚀💸
🏷Remember, the crypto market is dynamic in nature and changes rapidly, so always use stop loss and take proper knowledge before investments.
#MATIC #Cryptocurrency #Breakout #DYOR

MATIC - FEBRUARY, MARCHIf we take the liquidity from the bottom of the sideways movement and return to it back. Then we can safely expect a goal of $1.
As you can see, we have broken the structure on the 1-day timeframe. Therefore, I still expect a more red scenario where I can safely go long.

MATIC - FEBRUARYAt the moment, I am considering 2 scenarios.
1) If we take the liquidity from the bottom of the sideways movement and return to it back. Then we can safely expect a goal of $1.
2) From the current value, we will immediately go to the upper limit, then at least you can set a stop loss in a safe zone and wait for the denouement at the upper border of the sidewall.

MATIC LONGMATIC LONG, Matic just broke a major trend and made a double bottom showing signs of strength

MATIC/USDT Breaking the upwards bullishafter breaking the upwards bullish channel and forming a market structre shift, price went up to the 62% febo retracment level. Expecting a distribution range here before expanding lower to the support levels.
(FROM THE LOW TO THE HIGH WE DIDNT RICH THE 50% FIBO YET )

MATICUSDT potential falling wedgeHi traders,
Let"s take a look at MATIC chart on the 4 hours time frame. It is likely that the price is forming the falling wedge pattern. We expect the price to break out of the pattern. Long position can be taken after the successful breakout. Look for the volume increase in order to avoid trading the false breakout.

MATIC/USDT Could MATIC back to break resist or back to demand ?💎 MATIC has recently experienced significant developments in the market. Currently, MATIC has displayed strength by bouncing from the demand area, which previously acted as a supply zone. Moreover, it has successfully broken out of a descending channel pattern.
💎 If this breakout is valid, there is potential for MATIC to continue its upward trajectory and attempt to break through the resistance area. Breaking this resistance is essential because a successful breakout, probability could pave the way for MATIC to reach our target at the Bearish OB area.
💎 However, if MATIC fails to sustain its upward momentum and experiences a false breakout, there is the possibility that the price will retreat to the demand area to establish a new bullish momentum.
💎 The demand area holds significant importance, as a breakdown from this level could signal a return to bearish sentiment, potentially driving the price back towards the strong support area.

MATIC longMATIC bounced off the lower boundary of ascending channel. Bullish movement to resistance level at 0.833 is possible.

Matic - Bullish Momentum BuildingPolygon (MATIC) has been trading within a horizontal accumulation pattern on the daily timeframe, attempting a breakout previously but lacking the strength to sustain higher levels. The recent breakout from the lower boundary of the accumulation range provides a renewed sense of strength, positioning MATIC for potential upward momentum. Additionally, on the hourly timeframe, the continuous confirmation of bullish intentions through bear traps contributes to the positive outlook.
🔄 Daily Accumulation and Breakout:
MATIC's extended consolidation within the daily accumulation pattern signaled a period of indecision and potential accumulation of positions. Previous attempts to break out to the upside were met with challenges, preventing sustained upward movement. However, the recent breakout from the lower boundary suggests a shift in dynamics, providing the necessary strength for potential growth.
🚀 Strength from Breakout:
The breakout from the lower boundary of the accumulation range grants MATIC a significant boost in terms of potential upward momentum. Successfully establishing a higher trading range could indicate a newfound market sentiment favoring bullish movements.
🔍 Hourly Confirmations and Bear Traps:
On the hourly timeframe, MATIC exhibits a pattern of continuously confirming its bullish intentions. The creation of bear traps, strategically inducing short-term downward movements, adds to the overall bullish narrative. These traps serve to shake out weak hands and provide additional fuel for faster growth.
💡 Trading Strategy:
Traders and investors may consider positioning themselves strategically in MATIC following the breakout from the accumulation range. Confirmations on the hourly timeframe, especially through the use of bear traps, can contribute to the overall bullish case. Implementing effective risk management strategies, such as setting stop-loss orders, is advisable.
🔮 Future Outlook:
The technical analysis suggests that MATIC is well-positioned for potential growth following the breakout from the accumulation range. Traders should remain vigilant and adapt their strategies based on real-time market data. The combination of the daily breakout and hourly confirmations, including bear traps, creates a favorable environment for bullish momentum. The cryptocurrency market's dynamic nature emphasizes the importance of flexibility and risk management in trading decisions.

MATICUSDTMATICUSDT was trading in descending parallel channel. The price was reacting well the support and resistance of channel.
Currently the price has given the breakout of triangle and now retesting the broken level where it is also forming a local support zone and seems like the price may go for another leg higher.
If the breakout sustain to upside the optimum target could be 1.00
What you guys think of this idea?

Matic is showing bullish signs againMatic is showing bullish signs again
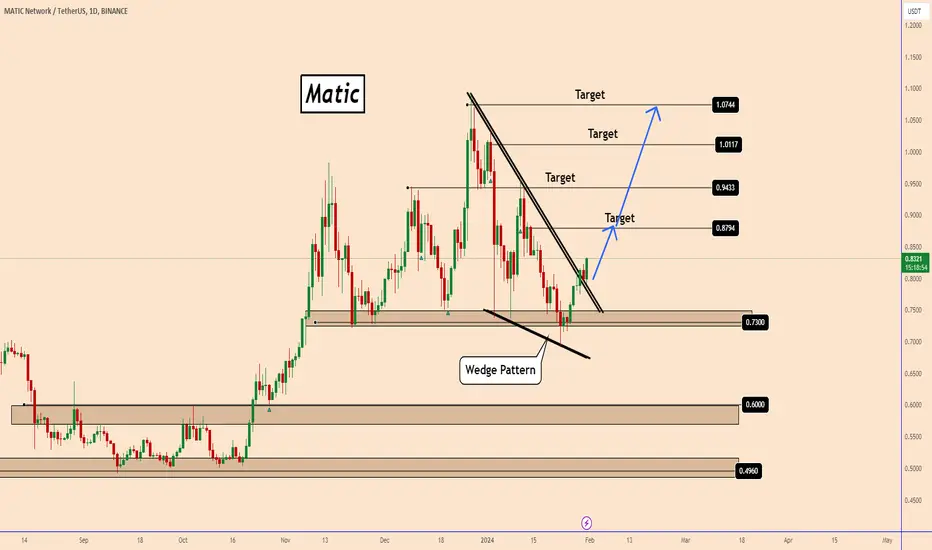
Matic broke out of a large daily Wedge Pattern confirming a potential increase over the next few days.
This is a pattern that I have shared before and the support area near 0.7300
stopped the price several times.
We could see strong bullish moves happening very easily after 0.7300 was tested.
Matic is expected to react in the same way.
You may find more details on the chart.
Thank you and Good Luck!
❤️PS: Please support with a like or comment if you find this analysis useful for your trading day❤️
MATIC long Matic failed to break pervious low and tested that level multiple times and then break of structure accrued. it also trading above Vwap on 5mins chart frame. now, its going to test pervious day high which is at $0.8220.
wait for pullback for better entry and make sure if Matic starting trading below $0.7930 close it.

Polygon Chart Analysis: Daily and 4-Hour PerspectiveWe're eyeing a particularly interesting chart: Polygon BINANCE:MATICUSD . On the daily chart, we're observing a very discernible cycle. While we've certainly seen very impulsive upward and downward movements in our last bull market, we've been convinced since the summer of 2022 that we completed a downward correction and have since developed a Wave (1) and (2) with an overshooting B, now finding ourselves in the overarching Wave (3). This should, at a minimum of $2.
🔎 Zooming into the 4-hour chart, we've hit our 50% retracement limit order for the subordinate Wave 2 at $0.74, witnessing a very nice correction to this limit order. On closer inspection, we have an Expanded Flat with Wave B at 138%, which is the maximum for an overshooting Wave B. Thus, this scenario seems to be accurate.
📉 However, there's always a chance that we might dip again, possibly retesting the 50% or even the 61.8% levels. Yet, we should ideally not drop below our 78.6% mark, which is our $0.60 level. Falling below this would make it highly unlikely that we're still dealing with a Wave 2, and should we fall under the 78.6%, we must consider the possibility of a decline to the origin point X, $0.49.

MATICUSDT IDEAUPDATE
Falling Wedge Breakout Has Already Confirmed Retesting In Process In case Of Successful Retest Expecting 20-25% Bullish Rally ✍️
COIN DETAILS
MATIC is the network's native cryptocurrency, which is used for fees, staking, and more. You can buy or sell MATIC via exchanges like Coinbase. The Ethereum blockchain is home to a vast range of economic activity — from NFT markets and games to the growing DeFi ecosystem.

MATIC CLOSE TO BREAKING ALL TIME RESISTANCEMATIC is currently trading withing a confined trendline and would need to break above this zone to push beyond it's all time high and possibly get beyond $10. we would need to see price move with momentum either from the demand zone or after a break from the supply area

MATIC shortMATIC broke trough the ascending trendline. Asset broke trough the support level. Bearish movement to support level at 0.74 is possible.

MATIC/USDT BREACK DOWNAfter we Take the BSL and touch the Bearich Trend line we made a nice Displacement To the Down Side
i have take a Short potion and targeting the LL

MATIC-USDT / 1H / TECHNICAL ANALYSIS BINANCE:MATICUSDT Resistance at 0.8080, support at 0.7389. My target for wave analysis is 0.7983.
Like and comment if you find value in our analysis.
Feel free to post your ideas and questions at the comments section.
Good luck

MATIC LONGMATIC LONG
Bounced of the demand zone and break structure @ 0.74
Looking for longs to the next supply zone
TP1 0.76
TP2 0.77
TP3 0.78
TP4 0.79-0.80
SL 0.69
Leverage 5-10x
Risk 2% of your balance

0.90 to 1.10 MATICAnalyzing the current market trends and technical indicators, my projection for #MATIC in the upcoming 2024 bull market is a price range between $0.90 and $1.10 USD.
This valuation is based on several key factors, including historical data, recent market performance, and the overall growth trajectory of the cryptocurrency sector. #MATIC's fundamentals, coupled with increasing adoption and technological advancements, suggest a strong potential for this price range to be achieved.
As always, it's crucial to monitor market dynamics closely, as cryptocurrencies can be volatile and subject to various external influences. This forecast considers both the potential market highs and the resilience of #MATIC in sustaining its value in a fluctuating market.


Eventually centerline will break to the downsideGood day, got question for BINANCE:MATICUSDT bulls. Why invest in a alt that has already over extended so much? Possibly the next alt season in 2024 & 2025 will favor the alts that corrected over 90% since March 2021?
