Matic/UsdtCRYPTOCAP:MATIC is displaying positive signs, and the chart includes marked levels for reference.
NASDAQ:ALT LSE:JUP $TRIAS NYSE:SUI SEED_ALEXDRAYM_SHORTINTEREST1:CHNG #CryptoCommunity
MATICUST trade ideas

matic up The Metic currency is accumulating in a triangle, the best price for investment is the range of sixty cents

MATICUSDT - Symmetrical TrianglesTwo symmetrical triangles the first leading to a large breakout of around 16000%. Will we see anything comparable in the future


Matic with Head & Shoulder patern In the 4h chart it rebounded after broke down the neckline of the H&S pattern
But it broke down the triangle in the 4h and we can set the SL at (0.7379) to get better R/R
TP1: 0.6170
TP2: 0.5755
TP3: 0.5311
TP4: 0.4867
TP5: 0.3428

MATIC knows what's happeningIn my bearish thesis, coins have time until 2024 summer. There are some good altcoins that will go up only until then. And there are some like MATIC that shows what's about to happen.
MATIC chart is really interesting. A chart like social experiment :D There is no way you can be macro bullish about this.

MATICUSDTI propose to consider the medium-term situation, because in the short term everything looks bad. A symmetrical triangle figure appeared on the chart. The price can go both up and down with a 50/50 chance.
In case of an upward movement and consolidation, it is worth considering the targets indicated by blue lines.
Target 1 - 1.1517
Target 2 - 1.3871
Target 3 - 1.5898
In case of going down and consolidating below, focus on the red lines as support in the area of 0.4007 - 0.2334
Also you can ask for only 1 altcoins analysis and i will try to do my best to cover as much as i can✍️

MATIC USDT - Global Re-buy Zone!Entry: 0.5698 - 05127
SL: 0.4700
Exit Targets - Will be updated if entries are filled.

MATIC USDT - Global Re-buy ZoneEntry: 0.5698 - 05127
SL: 0.4700
Exit Targets - Will be updated if entries are filled.

MATICUSDT_N38MATICUSDT
En: 0.382 and 0.27
Sl: 0 (1% of your balance)
Tp: 1
(Check the picture or tradingView for Numbers)
Cancel if Tp crossed without opening
#30Min_trade
#N38

MATIC/USDT TAKE THE WEEKLY LQ After we Take The Weekly LQ we Made a LTF Displacement so i will Take a Long Entry and Target The High Of The Day Where is the BSL Too

MATIC Bearish Scenario Matic breakdown very important and strong support zone...
After Retest I will Enter Short

MATICUSDTFrom the data shown on the chart, we find that as long as the currency does not break the bottom of the area 0.5 usdt , this indicates the accumulation of a new wave of payment, in addition to the fact that the currency against Bitcoin has been going sideways for 31 monthly candles, and this indicates the upcoming stages of accumulation and a calming of the previous indicators of inflation.
All data on the chart.. Good luck


A good position for MATICHello everyone.
All the numbers on the chart : the Entry , Take profit areas and Stop loss are specified.
It seems that the price indicated by the star symbol will be touched before the price indicated by the no entry sign. NOW entry

Polygon (MATIC)Polygon (MATIC), valued for improving Ethereum's scalability, is the focus of our analysis today. We focus on the price outlook for MATIC for the near future. In this article you will find a technical analysis from our Premium area.
Want to know more after reading or have questions? For only 1 euro you get 30 days access to our Premium environment, where you can ask questions directly to our analysts. Remember: our analysts are not financial advisors.

Polygon(MATIC): Breakdown In Process!! Good To Short?This one caught our attention as well, with a full-scale breakdown happening right now in the local trend zone.
We are seeking a breakdown here to take full control of the trend where daily closes and secure that zone. It might be a really good opportunity here, for sure!
Swallow Team

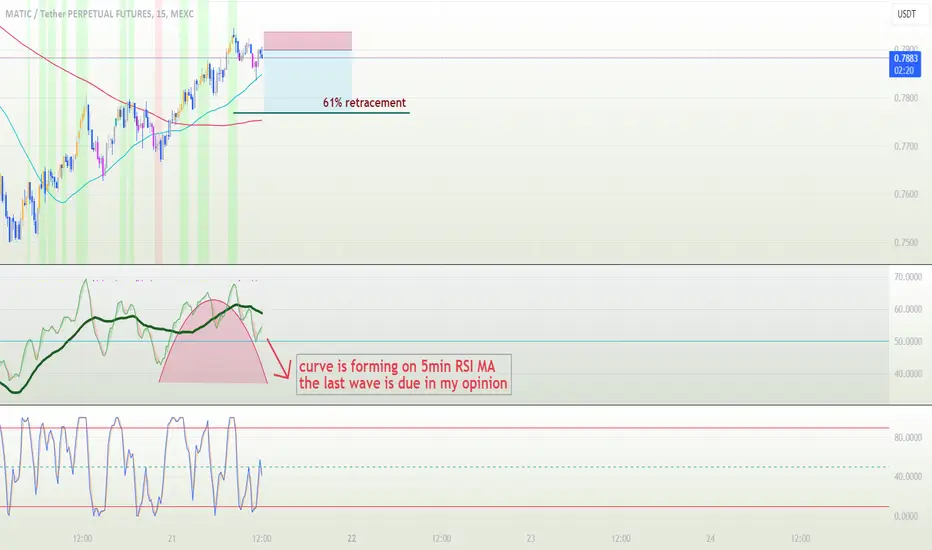
another perfect curve is forming on RSI for MATIC USDT pairexciting to share another opportunity for intraday trade on MATIC USDT pair
the actual trade is seized on 5min timeframe which is not allowed to share on this platform
the screen shot is attached
MEXC:MATICUSDT.P
MATIC → Polygon Showing Reversal Signals? A Short Scalp is Near!MATIC (Polygon) is holding above the Daily 200EMA support and has yet to break it after making contact 5 times since breaking it. So why is a short scalp reasonable?
How do we trade this? 🤔
We have a few good reasons to be looking for a counter-trend trade; There have been several sell-offs in the $0.95-$1.10 range, a very strong sell-off at $1.10, the 200EMA support has been tested 5 times which adds to the probability it will be broken, and the RSI is at 50.00 and below the moving average.
These data points tell us it's time to start looking for counter-trend setups, but we cannot enter a trade until we see confirmation to enter. What we need is a final test of the $0.98 area to get a good entry around $0.93-$0.95. From there, we can short half of our position to the 200EMA ($0.79), take profits, move our stop loss up to our entry price, and then swing the rest of the position down to the Support Zone at $0.665.
Taking profits at the 200EMA is about a 1:1 Risk/Reward if our stop is placed just above the previous high at $1.11. That is a reasonable scalp, and the rest, being a bit lower probability of success, allows us to swing the second half of our position without the worry of losing money. We could repeat this approach until either the 200EMA Support breaks or the $1.10 high breaks and stops us out, which lets us know the upward momentum isn't done yet.
💡 Trade Idea 💡
Short Entry: $0.95
🟥 Stop Loss: $1.11
✅ Take Profit #1: $0.79
✅ Take Profit #2: $0.67
⚖️ Risk/Reward Ratio: 1:1.75
🔑 Key Takeaways 🔑
1. Several Sell Signals at Key Resistance area of $0.95 to $1.10
2. Strong Sell Signal After Hitting $1.10
3. Wait for One More Failed Attempt to break $0.95
4. Short a Sell Signal off of $0.95-$1.00 Price Area, Stop Loss above Previous High of
5. RSI at 50.00 and below Moving Average.
💰 Trading Tip 💰
It's reasonable to take half profits at the first support target in a short trade, or the first resistance target in a long trade. You can then move your stop loss up to your entry price and watch the rest of the trade execute without worry of losing money. This helps improve trading psychology and the equity in your account.
⚠️ Risk Warning! ⚠️
Past performance is not necessarily indicative of future results. You are solely responsible for your trades. Trade at your own risk!
Like 👍 and Follow to learn more about:
1. Reading price action
2. Chart analysis
3. Trade management
4. Trade psychology

MATIC as a bluechip start to rise!Matic has touched and it has broke the 1$ resistance level. With a good price structure and a good overall momentum, it can create a massive bullish trend.
As you can see , we have a broken nek line of a bullish H&S at 1$.
The possible potential Targets are 1.7$ and second 2.7$ and far above if a good and strong trend will establish.
I think that here we have a very good opportunity.
good trading

A perfect curved is formed on 1hr RSI for MATIC USDTMEXC:MATICUSDT.P
I just realized that a perfect curve is forming on 1hr chart for RSI oscillator in MATIC USDT pair lets capitalized this opportunity

#MATICUSDT4-hour timeframe analysis
The price is currently 0.775 dollars. Considering that our yellow trend line has broken down, if it cannot break up again in the pullback movement, the price may decrease to 0.72 or even 0.67. As soon as the up trend line breaks, it will be easy Target 1 and then target 2 will be touched.
Technical analyst: Amir Hassan Salek

maticusdtThe trend I expect from this currency My analysis is according to Ichi Moku's method and I don't have any further explanation for my analysis because everything is indicated on the chart
