$MATIC Inverse Head and Shoulders Reversal Pattern? CRYPTOCAP:MATIC appears to be printing a inverse head and shoulders pattern. If it breaks above the neckline then it may try to test the upper resistance lines at $0.96, $1.00, $1.03, $1.09. If it sustains a break above $1.00 then it might breakout?
Just questions. Thanks.
MATICUST trade ideas


MATIC/USDT 4HIntervalI invite you to review the chart of MATIC in pair with USDT. First, we will use the blue lines to mark the upward trend channel in which the price is fighting at the lower border.
Let's move on to determining the support, and for this purpose we will unfold the trend based fib extension grid, thanks to which we can see a strong support at the level of $0.76, however, if the support is broken and the price leaves the current channel lower, it may result in a price drop close to the height of the channel, which could bring the price to a very strong support zone from $0.61 to $0.53.
Looking the other way, we see that the level of $0.86 has effectively reduced the price, only when we go higher, the next resistance is at the level of $0.95, and then we have a visible strong resistance zone from $1.01 to $1.08. At this point, it is worth defining the local downtrend line, which confirms the $0.95 level, as an important resistance.
It is worth looking at the RSI indicator, which shows a movement in the lower part of the range, which gives room for possible increases, and what is more, the situation looks similar on the STOCH indicator, but it is worth remembering that we are still in a downward trend and a lot depends on the behavior of the BTC price.

$MATIC May reject at $1.00 and retest support at $0.70 or lower CRYPTOCAP:MATIC The double bottom has played out to the upside reversing after a false breakdown to $0.7245. It's printing green now and following the cup line. May reject at $1.00 and retest support at $0.70 or lower accumulation zone?
Just ideas and questions. Not advice.

$MATIC Double Bottom Reversal to Test ResistanceCRYPTOCAP:MATIC double bottom and false breakdown has reversed appearing to continue to test resistance lines? A rejection at $1.03 may cause another test of the lower level support areas between $0.58-$0.80? When it makes it past $1.09 and sustains approve then a continuation to ATH may begin?
Only questions. Do your own research. Not advice.

Matic Plan 0.05The Matic graph is moving in an Elliott wave pattern. Wave (C) has a 1-2-3-4-5 subwave structure, which is an impulse wave. Now, it is in wave 2 of Wave (C), which is a correction flat. Wait for wave c of wave 2 to complete and then enter the trade at wave 2 of Wave (C) to target wave 3 of Wave (C).

$MATIC Double Bottom with False Breakdown?CRYPTOCAP:MATIC Double Bottom with False Breakdown?
Has CRYPTOCAP:MATIC formed a double bottom with a false breakdown at the support line?
Next Fib. level lower $0.7337.
Just questions.

$MATIC Consolidating at $.80 CRYPTOCAP:MATIC Consolidating at $0.80
Upside to $0.88 and back down?
Upside to $1.03-$1.09 before continuation?
Breakdown to lower levels at $0.66-$0.73?
Polygon|The possibility of a BEARISH trendHello guys, I hope my analysis was useful for you.
This is my overview of Matic, check it out if you like.
Last week we expected more growth from the support zone, which invalidated our target areas with a strong bearish lag.
Now the upward trend that came in the form of a channel is placed on a support area.
I expect that with the breaking of this downward channel and the stabilization of the price below the support area, Metic will enter a downward trend, which will first experience the support area of 0.62 and then continue its decline until the price of 0.52. .

Polygon MATIC is heading for its next bull runA bullish pennant on the weekly timeframe indicates a move upward. Considering the bullish momentum we could go up all the way to $16.

MATIC IS AN INVESMENT -NOT 100X BUT A GOOD INVESTMENT Matic has adam and eve formation plus W pattern is oncoming check and act according to your risk management.

MATICIn the weekly timeframe, the price is below the black long-term trend line, and on the other hand, it is on the purple support.
If it loses the support, the right point to buy is the lower yellow, and if the trend breaks up, we will go to the upper yellow.
In the 4H time frame, the third collision with the bottom of the channel has been formed, and if we see signs of reversal, we can enter. Also, if the bottom of this channel is broken and the price returns to the channel again, we will buy safely

matic The first matic scenario... can happen like this.... and in the next post I will include the second matic scenario.

Matic is on fire!I think the cup and handle will be generated and we will go for 1.5$! Stop loss will be close and will be less than 0.77! First tp:1.27

MATIC ANALYSIS🔮 #MATIC Analysis 🚀🚀
💲💲 #MATIC is trading in a Symmetrical Triangle Pattern and trying to breakout the channel but rejected from the resistance zone. We may see a rejection till its support area. But if the price of #MATIC breaks and sustain the higher price then will see a pump 📈📉
🔰 Current Price: $0.8368
🎯 Target Price: $1.5483
⁉️ What to do?
- We have marked crucial levels in the chart . We can trade according to the chart and make some profits. 🚀💸
🏷Remember, the crypto market is dynamic in nature and changes rapidly, so always use stop loss and take proper knowledge before investments.
#MATIC #Cryptocurrency #Support #Resistance #DYOR

✴️ Polygon Goes Bearish (Full Analysis)We looked at Polygon recently, we saw a bullish pattern with a bullish breakout, yes!
But later there was no follow up and the bears showed up with force.
The bears (sellers) pushed the price of MATICUSDT down but EMA50 worked as support, this happened 3-Jan. as shown on the chart.
Two days MATICUSDT remained above EMA50, the bulls feeling safe... Today, everything changed.
➖ MATICUSDT is now trading below EMA50 but confirmation is needed once the daily session closes below this level (0.8528).
👉 Trading below EMA50 means that medium-term bearish potential has been confirmed. For us medium-term means between 1-3 months.
Below EMA10 short-term bullish potential becomes active;
Below EMA21 short-term bearish potential is confirmed;
Below EMA50...
Will it recover above EMA50 and become bullish again?
This is what happened 20-Dec., so a correction is more likely than a recovery at this time.
To me the correction is already confirmed, I've been bearish since November 2023 but we are not all the same... Some people take longer to realize, or better yet, to accept what the chart continues to say.
The RSI peaked in November so we have the bearish divergence and now moving below 50, all pointing lower... It worked on the way up, it works on the way down as well. These are simple signals yet very strong because simple is always best.
Targets can be seen on the chart.
Thank you for reading.
Namaste.

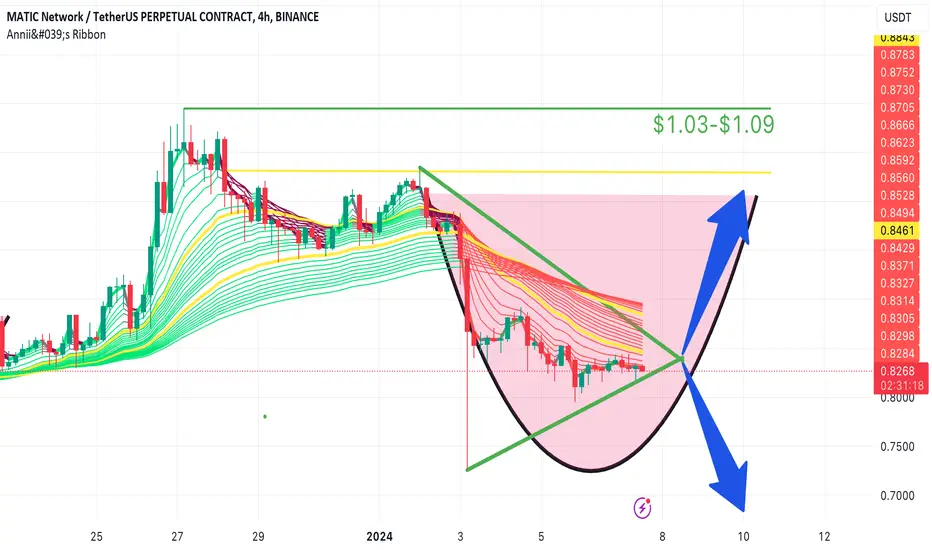
$MATIC Accumulation Zone Before Attacking Prior Resistance LinesCRYPTOCAP:MATIC Polygon is putting in a bottom $0.71 to $0.82. The EMA ribbons are barely turning green on the 4 hour chart. Wait for it to turn green. Looks to take 8-10 days to play out before the trend will clearly reverse since the drop to $0.71. This consolidating has reset the RSI and funding rates. A sustained break above $1.03-$109 will start a powerful impulsive wave up toward $1.60-$1.80. I'd expect a "last level of support" rejection from $0.96 area back down to $0.82. Then blast off. Note: Scam wick safer liquidation prices below $0.68 to $0.50.
Do your own research. Just an idea.

polygon matic x10 project potential 2025support levels
take profit levels
potentiall matic x10 in 2025
dyor

MATIC → Polygon Breaks Resistance! Should we Long or Short? MATIC has broken above the Previous Resistance Zone and is currently re-testing it as support. Is this a scenario where we enter a long? Or are we at the top ready to short?
How do we trade this? 🤔
We can play either scenario, but we need confirmation in one of the directions to have enough justifications to enter a trade. If the price comes back up and successfully tests the Support Zone, then it's reasonable to long scalp to the next Resistance Zone at $1.19. If we break below and re-test the Support Zone as resistance, it's reasonable to short scalp near the Support Line. Bitcoin is also at a crucial point in the market cycle, we need to see if it falls or breaks out to and above $46,000. Bitcoins direction could (and probably will) drag the alt market with it.
We need that confirmation to have enough probability to enter a trade. We're stuck in limbo without a clear direction at this point and should remain on the sidelines until more price actions prints on the screen.
💡 Trade Ideas 💡
Short Entry: $0.93
🟥 Stop Loss: $1.00
✅ Take Profit: $0.86
⚖️ Risk/Reward Ratio: 1:1
Long Entry: $1.065
🟥 Stop Loss: $0.970
✅ Take Profit: $1.160
⚖️ Risk/Reward Ratio: 1:1
🔑 Key Takeaways 🔑
1. Broke Above Previous High, Testing for Support.
2. If Price Falls Below Support Zone and Fails Re-test, Short.
3. If Price Rises Tests Support Zone and Closes, Long.
4. RSI around 61.00 and above Moving Average, Short-term Bias to Long.
5. Keep an eye on Bitcoins Price Movement as a leading indicator.
💰 Trading Tip 💰
Don't trade without clarity. If the price action isn't giving you favorable probability or optimal entries, don't trade it. You will be far wealthier by waiting on the sidelines.
⚠️ Risk Warning! ⚠️
Past performance is not necessarily indicative of future results. You are solely responsible for your trades. Trade at your own risk!
Like 👍 and comment if you found this analysis useful!

✴️ Polygon Bullish Consolidation Pattern |Bearish Potential WeakIt's been 42 days since Polygon hit a wall and we have not seen lower prices.
➖ On 14-November MATICUSDT peaked and went on a small retrace; bearish potential did not developed any further.
➖ Currently we can see a bullish flag which works as a continuation pattern.
➖ MATICUSDT is trading above EMA10 & EMA21 (short-term) as well as MA200 & EMA200 (long-term). Bullish all across.
➖ The RSI is trending higher and above 58, really strong.
All the signals are bullish and the bears failed to pushed prices lower.
➖ The main support stands at EMA200 (0.7427).
Any trading above this level and Polygon continues 100% bullish. If it moves lower, more red can happen.
👉 On last note: One billion ($1,000,000,000) USDT has been minted just now, which normally translate into —the whales and exchanges are about to push Cryptocurrency higher.
Namaste.

MATICUSD - Monthly Bullish DivergenceAn example of a bullish divergence in which price prints a higher low while the RSI indicator on this Monthly timeframe prints a lower low. This is a sign that upward movement is to come.

Observasi MATIC/USDT saat ini (per 4:26 WIB, Kamis, 4 Januari 20As of right now, 4:26 PM WIB on Thursday, January 4, 2024, here are some observations about MATIC/USDT:
Price: MATIC is currently trading at $0.8625 USDT, down 12.30% in the last 24 hours and 17.30% in the past 7 days. This represents a significant decline from its all-time high of $2.92 reached in December 2021.
Image of MATIC/USDT price chartOpens in a new window
beincrypto.com
MATIC/USDT price chart
Trading volume: The 24-hour trading volume for MATIC/USDT is $1,109,279,154.40, which is still relatively high despite the recent price drop. This suggests that there is still a lot of interest in the market for MATIC.
Market sentiment: The current market sentiment for MATIC is bearish, likely due to the recent price decline and the broader downturn in the cryptocurrency market. However, there are still some analysts who believe that MATIC has long-term potential due to its strong fundamentals and growing adoption.
Technical indicators: Some technical indicators, such as the Relative Strength Index (RSI), are suggesting that MATIC is oversold, which could lead to a potential bounce in the short term. However, it is important to note that technical indicators are not always reliable and should not be used as the sole basis for making investment decisions.

Updated Targets for Polygon - MATICQuick Updated levels to watch for MATIC, now that all of our previous levels have been hit- This coin is going to dominate over the next bull run. I Recommend everyone have some in their portfolio.
Levels to watch!
Breakout Level: $1.07
Updated Target 1: $1.79
Updated Target 2: $2.18
What is Polygon (MATIC)?
Polygon, formerly known as Matic Network, stands as a pioneering and user-friendly platform designed for Ethereum scaling and infrastructure development. At its core is the Polygon SDK, a versatile and modular framework supporting the construction of various application types.
For an in-depth exploration of Polygon MATIC, refer to our detailed analysis of the project.
Through the utilization of Polygon, developers can create optimistic rollup chains, ZK rollup chains, standalone chains, or any other infrastructure required for their applications.
Effectively, Polygon transforms Ethereum into a comprehensive multi-chain system, often referred to as the Internet of Blockchains. This model closely resembles others such as Polkadot, Cosmos, and Avalanche, boasting the strengths of Ethereum's security, vibrant ecosystem, and openness.
The CRYPTOCAP:MATIC token remains a pivotal element, continuing to exist and playing an increasingly significant role in securing the system and facilitating governance.
As a Layer 2 scaling solution, Polygon (formerly Matic Network) is endorsed by major players like Binance and Coinbase. The project aims to drive widespread cryptocurrency adoption by addressing scalability challenges prevalent in numerous blockchains.
