MATICUSDT - price adjustmentPolygon
MATIC
The price turned down and broke below $1 on Jan. 2. The MATIC/USDT pair witnessed a massive fall on Jan. 3, plunging to $0.74. This sharp decline suggests that the pair remains range-bound between $0.75 and $1 for a while longer.
Buyers will have to drive the price back above the 20-day EMA ($0.91) to reduce the selling pressure. That could result in a rally to $1. On the other hand, if the price stays below the 50-day SMA ($0.85), the pair could slide to $0.70.
MATICUST trade ideas

MATIC spot longLong matic on spot, target 1: 0.95-0.97$
Buying this dip is must do. Even if we dip further buy more and use same target.
When others are in fear it's time to buy :)
See ya.

Matic is going to pump around 1000%! just buy it hereSee the video, Everything is explained there. As you can see in the analyze we expect a huge pump for MATIC in the coming month.

Lets See ↓For First we can see Double Top But When you wait maybe now you see Head & Shoulder pattern. We can see the Coin Act, she wants coming down i dont know why but she is crying ... ;) !!!

MATIC/USDT 4H BEARISH IDEASince a bad news came about BITCOIN ETF and whole market crashed, so I expect big coins like MATIC to plummet more in June 2023 range or below.
leveraged trade can be opened with low leverage like 3x -5x.
Previous long analysis becomes invalid here.

MATICUSDT Long Opportunity I can see that on the 1H Matic still in up trend and it was just a pullback. If this is the pullback, then why not opening long here. Of course i could be wrong that's why I'm sticking to my plan!
One more thing i again did not wait for the 1H close candle 😅

MaticusdtPrice at triangle resistance
Near long term Channet support
Breakout could result in 5$ price
chart invalid if triangle or channel breakdown

MATIC/USDT bullish horizons from support retest?🚀Matic Analysis💎 Paradisers, watch closely as #MATICUSDT is displaying a pivotal movement, strongly holding its key support and signaling a high chance for a bullish move.
💎 Recently, #POLYGON underwent a retest at its support level, suggesting that if it can sustain momentum above this point, we're likely to see a substantial bullish push, aiming to overcome a major resistance level. A deeper analysis shows that #MATIC is exhibiting strong momentum, consistently trading above its EMA trajectory.
💎 Nevertheless, in the dynamic crypto market, being prepared for different scenarios is crucial. Should #MATIC find it challenging to hold its ground at the key support level of $0.9387, we might need to adjust our strategy.
💎 In this case, our Plan B, as savvy traders, would involve preparing for a bullish resurgence from a lower demand level at $0.8354. Staying vigilant is key, as a breach of this level could indicate a potential shift towards a bearish trend. 🌴💰

Matic Can Test 1.5 SoonMatic Can Test 1.5 soon
From the previous analysis, Matic found a strong support area near 0.7300 as expected.
The price is currently above the triangle pattern increasing the chances of a bigger bullish movement.
The targets we are looking at are realistic targets and the price was in the same area almost a year ago.
You may find more details on the chart!
Thank you and Good Luck!
Previous Analysis:

MATIC/USDT 4H LONG BULLISH IDEAMATIC has been consolidating near 1.00 range for a week and forming bullish structure. Huge bullish move is incoming in few days.

MATICUSDT——BIG PUMP MATIC
1D
Matic is really valuable.
It's very much out of the market and is worth a lot of shopping.
You can enter at 0.98 and what futures and spot to buy.
For the mid-term spot target is $1.5 and $3.
You must have.

GOLDEN STAR|At what prices should we be a MATIC buyer?In the 1h Matic timeframe, there is a critical demand area that covers a significant percentage and should be optimized in smaller timeframes. After several interactions with this area, we can observe that the upper limit has been breached, and it has taken the form of an upward trend, consisting of an upward movement, a correction, another upward movement, and currently a correction again.
I am in the price areas of 0.96, 0.95, and 0.9481 with the confirmation of the matic buyer in the one-hour time frame.
For selling transactions, I will wait until the price area of 1.06.

MATICUSDT: 4HR Bullish View! Hey Everyone,
BINANCE:MATICUSDT price first consolidated then accumulated which led to clear and successful distribution. Imbalance area need to be settle and therefore we aiming at that region from which price will rebound correctly. Be patient and let price do its things once it falls in our entry zone, take swing entry.
Happy New Year in advance ;)


MATIC - Wyckoff Reaccumulation Schematic#MATIC
This looked like a simple flag initially, which is a great bullish continuation pattern, but since has evolved into a #Wyckoff Reaccumulation Schematic. The latter is actually a healthier option, and one which usually warrants less pullbacks vs the simple flag, that very often comes with sharp retraces.
The Volume is perfect, the OBV is perfect, the pattern is perfect, the timing during Trad Fi market close and end of year standard low volume is perfect...
Have you placed your bets?

MATIC IS AT BREAKING OUT FROM A SIGNIFICANT SYMMETRICAL TRIANGLEPolygon is at the cusp of breaking out from a significant symmetrical triangle. Be patient! Let the pattern fully develop, as the initial target for CRYPTOCAP:MATIC is set at $1.25, followed by a potential move towards $1.82!
MATIC looks strong!!A coin whose structure looks quite strong. However, the stop point is not very clear and carries high risk. It has already completed the retest and is ready to rise. Manage your own risk.

MATIC HEAD AND SHOULDERS PATTERN MACRO OUTLOOK TARGET 1.50-1.70Exposing the Elliot Wave count and Head and Shoulders Pattern in MATIC/USDT chart.
We can clearly see a resistance level recently broken and bactested. These are strengh signs and should push MATIC towards the 1.50-1.70 area level quite fast in the upcoming weeks.
Projection:
Between January up to early mid February to reach the target.
Long Position open at 0,9660. Riding the wave up to 1.50.
SWING TRADE or low leverage position.

MATICUSDT Symmetrical TriangleMATICUSDT is showing a Symmetrical Triangle currently breaking out and has now retested support.
On the other hand we've got MATICBTC on the relative low with an inverse head and shoulders pending bull break. Which further aligns with my MATICUSDT thesis.

MATICUSDT - BULLISH OUTLOOKMATICUSDT is currently showing a bullish divergence on the 4-hour timeframe Consider entering the trade within the range of CMP $0.7850 to $0.75, chosen based on the analysis of historical support and resistance levels. Place a stop loss at $0.7150 to mitigate potential losses. If any 4-hour candle closes below this level, it could indicate a reversal of the bullish trend.
Entry Price On CMP: $0.7850 (average entry within the specified range)
Stop Loss: $0.7150
Take Profit 1 = $0.8550
Take Profit 2 = $0.9250
Take Profit 3 = $0.9950
Take Profit 4 = $1.0650
Take Profit 5 = $1.1350
This trade plan allows for a phased approach to profit-taking while managing risk through a well-defined stop-loss level. Keep in mind that market conditions can change, so stay informed and adjust your strategy accordingly.

BUY MATIC/USDT NOW!!!!!!!!Matic just goa a falling wedge breakout and we already got a pullback am expecting a bullish move from this point to $1.15
JOIN AND ENJOY
Tell us what you think..........

maticusdtAccording to the structure of the chart in the daily time frame, the price moved downwards with the formation of the flag limit and left the fl by re-entering the flag limit and the long price gap to the mpl kink, you can enter into buying transactions at the specified prices and up to the level The price of mpl kink remained in the deal

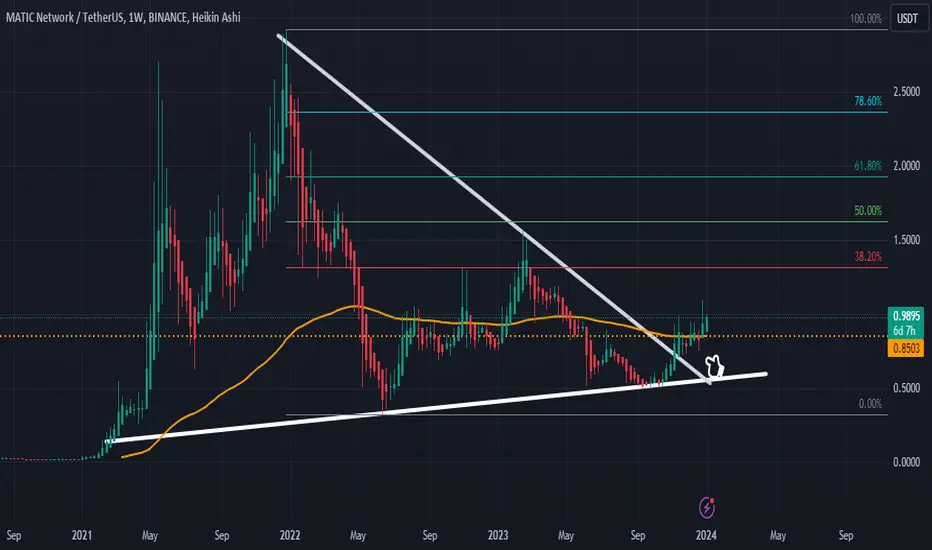
Demand zone I would like to believe on this chart but such an SPD marked with a white arrow usually means a decline. Many coins fell below where I expected them to rise. At the moment I'm in everywhere just in case. It may rise to the yellow line, but will likely bounce back down from there.
This may affect the MATIC, AVAX coins. I could be wrong, but that's what I believe today.
