MATIC looks bullishFrom where we placed the red arrow on the chart, it seems that MATIC has entered the correction phase.
The correction pattern appears to be a diametric.
The F wave can start from the green range.
Be sure to save some profit on the first target.
We are looking for buy/long positions on the green range.
Closing a daily candle below the invalidation level will violate the analysis.
For risk management, please don't forget stop loss and capital management
Comment if you have any questions
Thank You
MATICUST trade ideas

MATIC → Polygon Pullback to $0.35 then $0.70? Let's Answer.Since my February 3rd update, MATIC has remained in a trading range, as expected. We found resistance at $1.25 and then pulled back in two strong legs. Should we be bearish or bullish on MATIC?
How do we trade this? 🤔
As expected, MATIC found resistance at the Resistance Zone of $1.25 after two pushes up in the trading range followed by two legs down, leaving us below the Support Zone at a low of $0.50. We now see the price finding support in this area, and it has yet to show signs of strength.
It's not reasonable to enter a long here given that we lack a strong bullish candle close. We need to wait for a strong candle at this support area, but I believe it's more likely we will fall to the triangle low of around $0.31. Look for a signal and confirmation candle in this area then enter a long. Once that target is hit, take half profits at 1:1 Risk/Reward, moving the stop loss up to the entry price, then swinging the latter half of the position to 1:2 Risk/Reward.
We also need to watch Bitcoin's sentiment as the price action plays out. I expect Bitcoin will fall into a two-legged pullback to around $40,000-$45,000, which should take the alt market down with it, either keeping it in a trading range or bringing it to lower lows. Until Bitcoin's sentiment shows a clear bull signal after a likely pullback, it's one more indicator we should allow to play out before getting long in MATIC.
A final point of data is the RSI low and above the moving average of around 37.00. This indicates we are into the swing high and a long entry at this stage is warranted.
💡 Trade Idea 💡
Long Entry: $0.40
🟥 Stop Loss: $0.27
✅ Take Profit #1: $0.53
✅ Take Profit #2: $0.66
⚖️ Risk/Reward Ratio: 1:2
🔑 Key Takeaways 🔑
1. Two legs up toward a resistance zone in a triangle
2. Resistance met at $1.25, two legs back toward the triangle low
3. Look for a break below the triangle to the triangle low
4. Long entry justified after strong bull candle close near triangle low
5. RSI at 37.00 and below the moving average. Supports a long entry
💰 Trading Tip 💰
The longer a trend continues after 3 legs, the probability of that trend continuing lessens. Because of this decreased probability, we ought to reduce our risk when entering trades.
⚠️ Risk Warning! ⚠️
Past performance is not necessarily indicative of future results. You are solely responsible for your trades. Trade at your own risk!
Like 👍 and Follow to learn more about:
1. Reading Price Action
2. Chart Analysis
3. Trade Management
4. Trading Psychology

MATIC BACK AT THE BUY ZONEI can't look at the chart and tell myself this is a bad area to add to my positions seeing that we are at the overall Value Area Low & low of the range.
Calculate Your Risk/Reward so you don't lose more than 1% of your account per trade.
Every day the charts provide new information. You have to adjust or get REKT.
Love it or hate it, hit that thumbs up and share your thoughts below!
This is not financial advice. This is for educational purposes only.

IT IS MATIC TIME
After the price touched the weekly support level, it started to react to the upside and stayed above the 20-day moving average on the daily timeframe. Additionally, we have a harmonic shark pattern, which further confirms that the price is likely to pump upwards.


maticusdtIn the review of Metic in the time frame of 1 hour:
In the continuation of the trend, first, the correction of the previous upward trend will continue until the price of 0.5441. If it returns and the confirmation can continue until the price of 0.5836, unlike other currency pairs, the percentage of changes in the current direction has been slower.

A bullish setup is ripe for Matic
🎙️ Hi, Guys!
💡 My vision for Matic is quite optimistic. While many fundamental crypto projects are looking for a new bottom, a bullish setup is ripe for Matic.
💭 We have a fairly clear wave structure with the 4th wave of the Matic bullish rally represented as a contracting triangle. This is a pretty classic form for a wave 4. The correction which lasted 2 and a half years was quite effective both in time and in depth (0.382 Fibonacci). Obviously such a long-term correction should have driven “paper hands” out of the market.
🗯️ I don’t know the future but in accordance with the wave theory, it’s difficult to come up with a more correct entry point into an asset than now 😏
💬 With a positive outcome in the medium term, Matic can cost 4-5 💵 in the base scenario and up to 30 in the extra optimistic one 🤑 The cancel level of my marking is 0.4 $ 😱 The profit factor will be more than 30. I guess it’s good deal 👍
Let's try to ride the fifth wave 🌊
Shaka 🤙
BINANCE:MATICUSD BINANCE:MATICUSDT CRYPTO:MATICUSD OKX:MATICUSDT COINBASE:MATICUSDT KUCOIN:MATICUSDT

MATIC: GENRATIONAL BOTTOM IS IN!!Hey everyone!
If you're enjoying this analysis, a thumbs up and follow would be greatly appreciated!
Welcome to this MATIC/USDT UPDATE MATIC looks amazing in the weekly time frame.
Last time when MATIC accumulated in a 610-day channel it led to 20,000 Returns.
Now, it is forming a symmetrical triangle kind of structure and accumulated in the triangle for more than 1200 days. Right now, it is sitting at the lower trendline of the triangle and also holding good support here. Buy some now and add more in the dip.
Must Hit Targets:- $2.84/$4.72/$7.16/$9.88
Overall it's a double-digit potential, so leave some % for a moon bag🚀
What are your thoughts on MATIC's current price action? Do you see a bullish pattern? Share your analysis in the comments below!

Is MATICUSDT Primed for a Bullish Reversal? Key Support LevelsYello, Paradisers! #MATICUSDT is making an interesting move, raising the probability of a bullish reversal from a key support level.
💎#Polygon is showing a high probability of bullish continuation from a strong support zone. We've seen #MATIC consistently respect the descending resistance, recently break upward, and complete a retest phase. Currently, it’s respecting internal resistance and approaching support at $0.5399, raising the probability of holding momentum at this key level and planning a bullish reversal.
💎If #MATIC can successfully sustain momentum, there is a high probability it will break above the resistance at $0.5700 and make a robust bullish move, targeting levels above this resistance zone. The price has already tapped this support level and made a significant upward move. We're expecting a repetition of the same reaction at this support level.
💎However, as sagacious traders, we must consider all probabilities. What if the price fails to take an upward ride from the support at $0.5399 and loses momentum? This would clearly indicate that seller sentiment is in control, and #MATIC could drop significantly.
Strive for consistency, not quick profits. Treat the market as a businessman, not as a gambler.
MyCryptoParadise
iFeel the success🌴

MATIC is approaching the trendHey Traders, in today's trading session we are monitoring MATICUSDT for a selling opportunity around 0.5400 zone, MATICUSDT is trading in a downtrend and currently is in a correction phase in which it is approaching the trend at 0.54000 support and resistance area.
Trade safe, Joe.

MATIC in bearish flag Hi dear traders
MATIC is in bearish flag,if the pattern is confirmed, we expect to reach the desired targets.
Let's see what happens
This is not financial advice ( DYOR )
Good luck 👍

MATIC 4H sell setup - July 11 2024#Matic is currently in a resistance zone, crossing below the blue trendline shall be the trigger to enter sell position
TPs: 0.4630 - 0.4320 - 0.3900
max lev: 3x

Frankly, I don't feel like explaining, the chart says it all !!BINANCE:MATICUSDT is consolidating to break out above the symmetrical triangle on weekly timeframe.
✨Traders, if you liked this idea or have your opinion on it, write in the comments, We will be glad.
_ _ _ _ __ _ _ _ _ _ _ _ _ _ _ _ _ _ _ _ _ _ _ _ _ _ _ _ _ _ _ _
✅Thank you, and for more ideas, hit ❤️Like❤️ and 🌟Follow🌟!
⚠️Things can change...
The markets are always changing and even with all these signals, the market changes tend to be strong and fast!!

#MATIC/USDT is trying to break the Diagonal Trendline in 4-Hour #MATIC/USDT is trying to break the Diagonal Trendline in 4-Hour TF!
Wait for BO/retest to open the Long position. The local resistance level is PWH $0.5775 and the support level is PWL $0.4275.

it can explodeit core fundamental is good and also it taken the lq it would a good time to invest int it

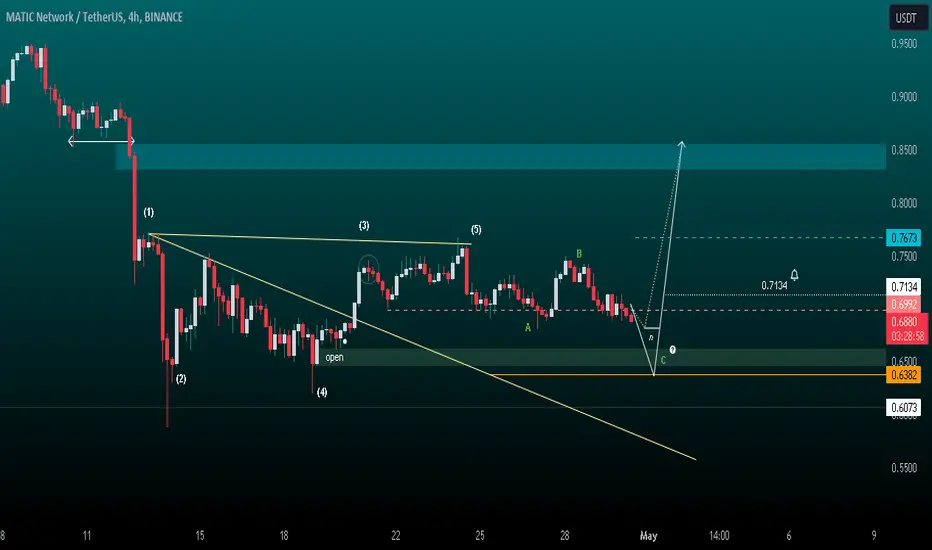
MATIC| Potential Drop to Near Lows For PullbackHello there,
MATICUSDT at H4, The bearish momentum is not clear below the resistance line of 0.6992; it could potentially move down to near-lows marked as (n) or lower to 0.6500 or even drop further down to 0.6073 to complete the sixth wave that follows ABC.
Since we cannot tell exactly where (C) might end up or if it would lead to an extension of ABC, 0.7134 is the only area for bullish interests.
The target is 0.7673 for a bias region of 0.8500. The current momentum takes up the bearish momentum in the daily time frame.
Happy trading,
K.
Alikze »» MATIC | Elliott Triangle pattern scenarioAccording to the previous analysis, the Metic currency went through an upward movement cycle. Currently, it is in a corner pattern in the weekly time, which was able to escape from it in the specified supply area with a short-term movement cycle.
💎 Currently, it has a corrective cycle up to the green box, which has moved downwards in a three-wave step in daily time.
💎 But now it can enter an upward cycle and retest the first supply area after confirming the green box. If confirmed, the area of upward movement can continue to extend to the base of the pattern, which can be checked further.
💎 Therefore, this upward movement can be followed in the form of wave 3 or 3 larger up to the specified areas.
💎 Alternative scenario: If the green box area is broken, this correction can be a combination correction that will have the ability to reach the 0.39 range.
»»»«««»»»«««»»»«««
Please support this idea with a LIKE and COMMENT if you find it useful and Click "Follow" on our profile if you'd like these trade ideas delivered straight to your email in the future.
Thanks for your continued support.
Sincerely.❤️
»»»«««»»»«««»»»«««

MATICUSDT.1DExamining the MATIC/USDT trading chart on Binance, I can observe several critical points and trends that inform my current trading strategy. The chart presents a detailed view of MATIC's price action against USDT, highlighting various support and resistance levels over the past year.
Currently, MATIC is trading at approximately $0.4944, which is close to the significant support level (S1) at $0.4121. This level is crucial because if MATIC continues to decline and breaks below this support, it could potentially signal further downward movement, possibly approaching lower levels historically tested around $0.3160.
On the resistance side, the first major resistance level (R1) is at $0.6538. Overcoming this level could open up the path towards the second resistance (R2) at $0.8119. A breach above R2, sustained by high volume, could indicate a strong bullish momentum, potentially leading to further gains.
The Relative Strength Index (RSI) is currently indicating a value of 35.16, which suggests that MATIC might be approaching an oversold condition. This could potentially attract buying interest if traders perceive it as undervalued in the near term.
Conclusion:
Given MATIC's proximity to a critical support at $0.4121, this is a key area to watch. If this level holds, it might offer a favorable buying opportunity for those looking to capitalize on potential rebounds. However, it is imperative to place a stop-loss order slightly below this support to manage risks effectively, considering the possibility of further declines. Should MATIC break above the resistance at $0.6538, it might confirm a bullish trend reversal, presenting an opportunity for traders to target higher price points up to $0.8119. As always, integrating this technical analysis with the latest market news and broader economic indicators is advisable to make informed trading decisions.

Polygon | MATIC The price of Polygon is $1.09 today with a 24hour trading volume of 444 million dollar.
After trading near the resistance line of the symmetrical triangle pattern for a few days, Polygon turned down and reached the support line but it still hold the uptrend
The flattening 50day EMA ($1.13) and the RSI below 50 indicate that the bulls may be losing their grip. If the price breaks below the support line, it will tilt the short term advantage in favor of the bears. The MATIC/USDT pair may then back to the 200day SMA 1 $ where the buyers are likely to mount a strong defense and hold the line.
The first sign of strength will be a break and close above the resistance line. That could open the doors for a potential rally to $1. 30
Polygon is gaining traction in the gaming industry with a surge in daily unique active wallets last month, according to DappRadar, the layer2 scaling solution recorded 138,081 dUAWs in March, a 53% increase from the previous month.this growth has pushed Polygon to become the second largest gaming blockchain, trailing only Wax Blockchain, which has over 314,976 daily unique active wallets.
Despite the decrease in on-chain gaming activity by 3.33% in March, games still make up a significant part of DApp activities, accounting for 45.6% of the industry’s activity in Q1 2023. Boomland’s Hunters On Chain, which launched on Polygon’s testnet last month, has already risen to become one of the top five blockchain games in terms of on-chain DApp activity.
next targets for short term are 1.15, 1.19 and 1.27$
what do you think about the price of Matic at the end of 2023? can we back to 2$?

Matic at Local bottom #matic/usdt
Accumulating CRYPTOCAP:MATIC at the weekly demand **zone
This is a bottom imo!

MATIC Weekly Chart Update.Hello everyone, I’m Cryptorphic.
For the past seven years, I’ve been sharing insightful charts and analysis.
Follow me for:
~ Unbiased analyses on trending altcoins.
~ Identifying altcoins with 10x-50x potential.
~ Futures trade setups.
~ Daily updates on Bitcoin and Ethereum.
~ High time frame (HTF) market bottom and top calls.
~ Short-term market movements.
~ Charts supported by critical fundamentals.
Now, let’s dive into this chart analysis:
After reaching a local high of $1.29 in March 2024, MATIC has been on a downtrend for almost 112 days. With the current market scenario, it is likely to see MATIC dropping a further 15% to 20% from the CMP.
The lower support ranging between $0.316 and $0.387 holds high liquidity and presents a decent entry level for MATIC.
Key Observations:
~ Lower Support/Entry: $0.387
~ Liquidity Level: $0.316 to $0.387
~ Resistance: $0.9860
~ Long-term Target: $2.923 (All-time high)
DYOR. NFA.
Please hit the like button to support my content and share your thoughts in the comment section. Feel free to request any chart analysis you’d like to see!
Thank you!
#PEACE

Matic longMatics long term structure is really strong and I am confident we have hit the low on this correction.
The shorter timeframes are suggesting a possible partial decline of the latest range just below the historical resistance at 75c. There is also the three valleys patter that has developed and confirmed.
Here you typically wait for a break and confirmation of 75c, however we've decided to partly enter the trade now, with the plan of adding above 75c if we break and confirm it as support.
The stop loss is placed below the secondary low and at the break of the shorter trend. You could make your stop loss looser if you wanted to trade the range low. If we get stopped out we will look for the opportunity to re-enter.
For this cycle my long term targets are:
1. $2.61
2. $3.62
3. $4.50
These are the targets for my spot hold, I wouldn't want to see the price break 60c for this play.

MATIC - ascending triangleI clearly see an ascending triangle in the chart. It's not broken out of yet. If the breakout happens to the upside and a retest of the top of the triangle is successful, then the measured move from the ascending triangle is a little over 4 dollars. If something goes wrong however and we break down or the breakout turns out to be a fakeout, we may see MATIC make its way down to 40 cent level over time. Sentiment to me seems bullish with many believing Bitcoin will hit 85k+ in December. If this happens, MATIC 4 dollars will likely occur.
