MATIC/USDT - Market Structure Analysis - 06.08.2023from the point of view of the structure, the price is in an extremely downward movement, until we see a fractal character change, it is best to just sell or at least stay away
MATICUST trade ideas

MATIC/USDTHi that is clear where is my buying zone on matic : first on 0.439 and second on 0.31usdt
be ready for that......
Goooooood Luuuuuuck

MATIC: The ride to 0.5$ may begin soon!Given the anticipated downward trajectory of BTC from its current levels, the price of MATIC will likewise experience a decline. Ant it has become more evident as the price has undergone four retests at the lower boundary of the triangle, indicating a potential greater downward movement soon!
Consequently, a break to the downside is expected, and it may be prudent to adopt a wait-and-observe approach for more favorable pricing opportunities.
It's said that one day, the mighty MATIC will set its course for the moon, but for now, it seems to be headed back down to Earth! Keep your eyes peeled and your senses sharp, as this journey promises to be a wild ride filled with unexpected twists and turns! :)

MATIC on the verge The future price of MATIC depends on which of the two lines breaks strongly...
If it breaks the red line, the behavior will be very bearish heading towards the orange lines, and if it breaks the green line, we will go towards the blue lines.
Unfortunately I think that the behavior will be bearish, since we have been in a bearish scenario for a long time. However, I still hold out hope for a bullish scenario due to the possible good news that may be coming regarding the Bitcoin ETF, which, if approved, would lead the entire market to rise in a very beautiful way.

maticusdtHi my friend
This is my point of view. I would be happy if you follow me and leave your comment

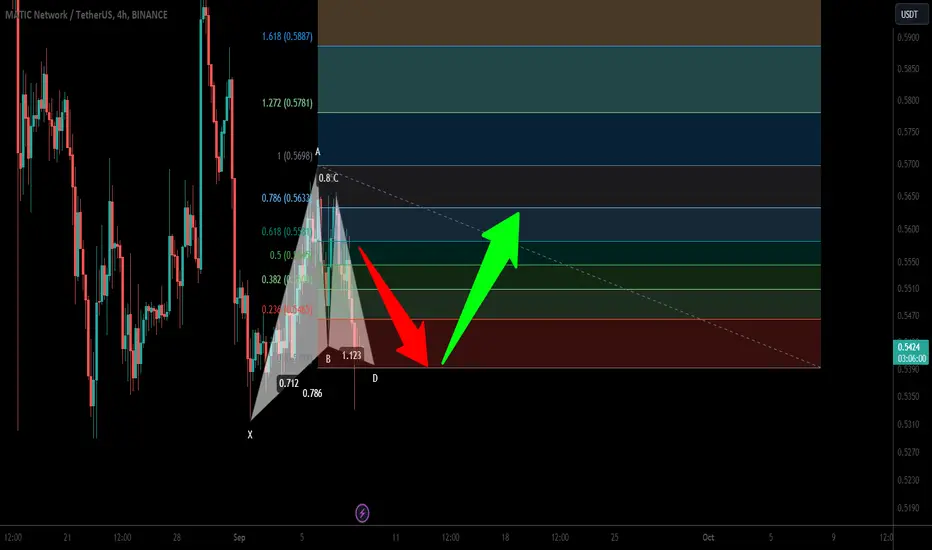
Polygon (MATIC) formed bullish Gartley for the next pumpHi dear friends, hope you are well and welcome to the new trade setup of Polygon (MATIC) with US Dollar pair.
Previously I shared a long-term trade signal of MATIC, which produced almost 250% rally as below:
Now on a 4-hr time frame, MATIC has formed a bullish Gartley move for the next pump.
Note: Above idea is for educational purpose only. It is advised to diversify and strictly follow the stop loss, and don't get stuck with trade.
MATIC/USDT 4H Interval Review ChartJHello everyone, I invite you to review the MATIC chart on a four-hour interval. First, we will mark with blue lines the downward trend channel in which the price is currently approaching the upper limit, which may provide an indication of the price direction in the coming days.
When we look at EMA Cross 200, we can see that a break above the current channel may result in a return to the strong upward trend for MATIC.
Let's start by marking support points for the price and we can see that first we have a support zone from $0.55 to $0.49, where the price is currently holding, but if the price drops lower, the next zone is from $0.41 up to $0.35.
Looking the other way, we can similarly determine the resistance areas that the price must face. And here we see that the price has currently bounced off the resistance at $0.61, then we have the first resistance zone from $0.67 to $0.71, and then we will move towards the second zone from $0.76 to $0.83 $.
The CHOP index indicates that there is still a lot of energy for a continuation of the movement, the RSI index is back to the lower part of the range, while the STOCH indicator indicates that MATIC has been oversold, which may affect the side trend or price rebound.

MATICUSD ❕ upward channelMATIC has fixed above 50EMA on the 4H TF.
RSI is near neutral values.
TD Sequential formed an upward reversal signal on 1H TF.
I believe that the price will continue to rise if it holds the channel.

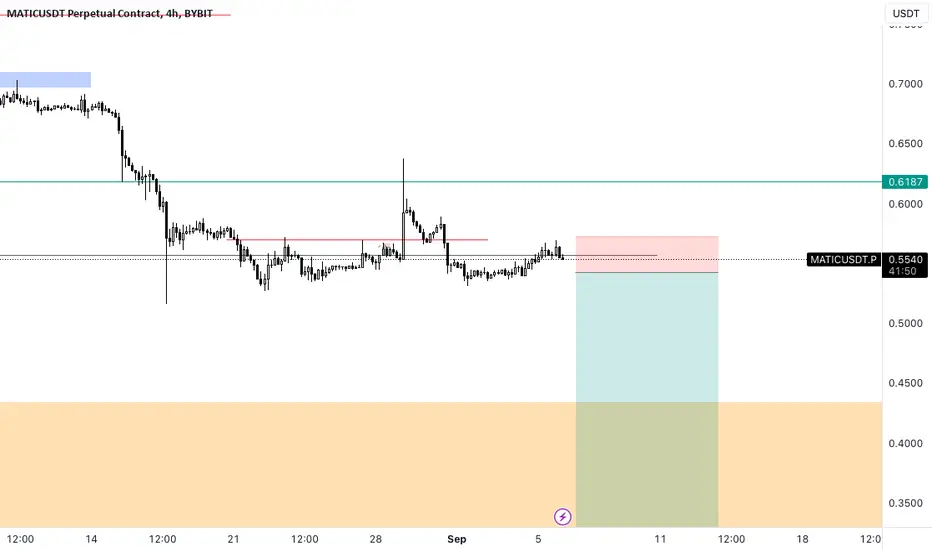
#MATIC low time frame short set - upClosing below 0.5466$ price level with 1H TF will lead the coin lower: 0.5366 - 0.5288$ (can be even lower, HTF chart is still valid you can check it)
Closing above 0.5576$ with 1H candle, means we will be able to see the coin at 0.5666 - 0.5785$ price levels and possible higher.

MaticUsdt 01this is my Idea about Matic.
Divergence between price and RSI.
If the channel breaks we reach to 1st and 2nd Target.
BINANCE:MATICUSDT

MATIC/USDT 1DAY UPDATE BY CRYPTOSANDERS !!Hello, welcome to this MATIC/USDT update by CRYPTO SANDERS.
CHART ANALYSIS:- Polygon (MATIC) was also trading higher in today’s session, with price climbing for a fourth straight day.
MATIC/USD peaked at 0.5634 on Tuesday, which comes following a low of 0.5406 to start the week.
As a result of the move, the polygon climbed to its most vital point since last Thursday, when the price reached a high of 0.5885.
with this current uptrend, it appears that MATIC could be heading towards a key resistance point of 0.6000.
the RSI, which is tracking at 40.08, will first need to move past an upcoming ceiling at the 41.00 level.
Hit the like button if you like it and share your charts in the comments section.
Thank you

MATIC short - swing trade We got stopped on our previous MATIC short but the trade idea remains the same.
Have re-opened some positions on it and will look to add the remainder around 0.5425$. Stops currently sitting above the current highs.
Plan remains the same as previously. Let's see what pa give us.
TP 0.50$
TP 0.45$
TP 0.32$
Stay safe and never risk more than 1-5% of your capital per trade. The following analysis is merely a price action based analysis and does not constitute financial advice in any form.
MATIC coin is on the long list with a level of 0.5698Hello everyone!!!
AIHermes today identified a MATIC coin on the long list with a level of 0.5698
The stop is short.
We see a long accumulation and a gorgeous squeeze!
1st target 0.5945
Trade with us, trade better than us!
Today:
16 coins on the long list
10 coins on the short list.
Coins on the short side.
The full list of coins is delivered by our bot every day at 9.00 am

✴️ Polygon Volume Signal With PatiencePoloniex is one of the old exchanges, volume tends to be low.
Volume is mostly low all across when the market is slow but tends to shoot up when a major wave is approaching.
This is the volume signal.
We can see MATICUSDT (Polygon) producing really high volume on a exchange with no volume, after early August, a month ago. This tells us that the action is getting started.
Now we can see how the volume changed from red to green... That's all we need to predict a price increase.
Matching this with what we are seeing all across the Altcoins market, we are sure to get it right, we are sure to win... With patience, because patience is they key.
Namaste.

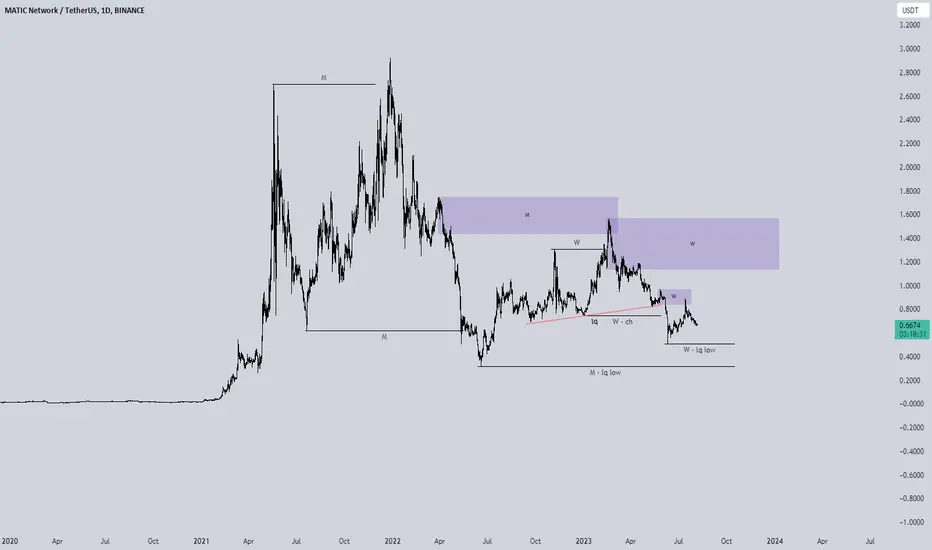
MATIC - 🚨 Attention sign!Hello friends!
Look at this analysis in MATIC:
We see Matic's weekly chart and its large drift from the all-time high.
Purple line:
Note that this line serves as an important support in this sideways process of Matic. However, it was lost the week of August 28th.
See the red signal on the chart, showing the rejection that occurred in an attempt to remain above this Trend Line.
This rejection could be the strong trigger for further declines, which would lead MATIC to test the orange line.
Orange Line:
This line understands to be the 0.382% fibonacci level and clearly a support that has been triggered a few times. If this occurs, Matic could experience a -30% devaluation.
Another important point is the zone of 50 and 0.618% fibonacci, located between 0.19$ - 0.09$.
Bullish bias:
The bullish bias would only be confirmed if there is confirmation of buying volume and prices are trading again above $0.70, resuming the uptrend and breaking a bear wedge that you can see on the chart.
Nothing can be ruled out.
Hope you enjoyed this review!
Leave the boost and follow me on Trading View!
