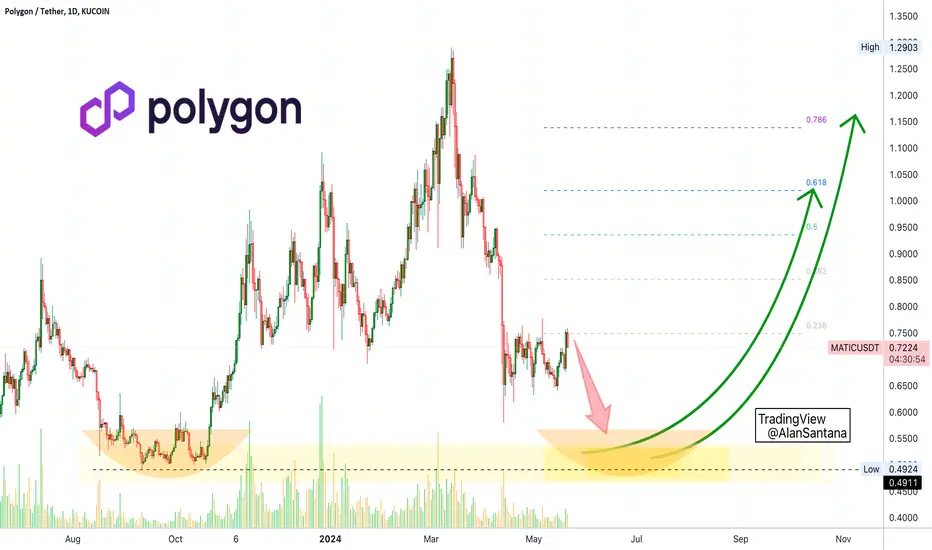
MATICUSDT 1DFalling wedge formation on the #MATIC daily chart. In case of a breakout, the targets are:
$0.6977
$0.8109
$0.9024
$0.9939
$1.0562
$1.1241
$1.2900
MATICUST trade ideas

#MATIC/USDT#MATIC
The price is moving within a bearish channel pattern on the 4-hour frame, which is a strong retracement pattern
We have a bounce from a major support area in the color EUR at 0.5340
We have a tendency to stabilize above the Moving Average 100
We have a downtrend on the RSI indicator that supports the rise and gives greater momentum and the price is based on it
Entry price is 0.5500
The first target is 0.5980
The second target is 0.6307
The third goal is 0.6720

Triangle's upper boundaryMATIC is currently trading within a tight range, establishing consistent highs and lows. The price is forming a large triangle pattern, indicating a period of consolidation. It is nearing the apex, suggesting that a significant move may be imminent. The upper boundary of the triangle acts as a crucial resistance level. Price action near this level should be closely monitored for potential breakout signals.
The lower boundary of the triangle provides strong support. Any movement towards this level could be an opportunity to assess the strength of the support.
A breakout above the triangle's upper boundary could lead to a significant upward move. Conversely, a breakdown below the lower boundary might result in a downward trend.

An expected scenario during the next weekWe are in a beautiful stage waiting for the event. My expectations and according to the models are that the global index is going to decline

Strong resistance level may challenge the priceFor MATIC, Breaking the $0.5800 resistance could lead to a strong upward move, while failing to break this level might result in a decline to lower support levels at $0.5592, $0.5270, and $0.5153.

Matic Trade Setup.Matic Trade Setup.
After a confirmed breakout from the trend line and green zone, we could take entry at $0.5687.
Remember stop loss is your friend. Everything is on the chart.
Entry $0.5687
S.L $0.5422
T.P 1 $0.5884
T.P 2 $0.6127
T.P 3 $0.6392

MATIC BULLISH SCENARIOseeing the current price of Matic is really good for looking a price that we will buying for , soon it will sky rocket with 600+% price hike

Matic Swing Trade IdeaSwing trade idea.
Asset: Matic
Bias: Long
Confluences:
•Fibonacci golden pocket/.786
• Loss of the value area low (likely a bullish loss of VAL-commonly mistaken as a fake out/liquidity grab
•Formation confluence (descending channel @ 4hr broadening wedge )
•Market cipher confluence on lower hourly timeframes (anchor wave confirmed on the 1hr + 30m bullish divergences.) Daily bullish divergence with 2D bull divs printing.
Entry Details:
I’ll be looking to enter on multiple drives of 3m bull divs + 6m bull divs.
Entry Zone: .5490-.5295
Stop loss: .5280
TP1: .5527 (VAL/1:1)
TP2: .5712 (POC)
TP3: .5824 (VAH)
TP4: 5973
TP5: .6290
TP6: .6807 (pVAL)
TP7: .7244 (pPOC)
TP8: .7414 (pVAH)
Concerns:
Swing Failure Pattern (SFP) is a possible. I will consider entering on a sweep of the previous wick even after getting stopped out. As long as you are risking 1-3% the win will outweigh the loss tremendously over time.

SSL HYBRID INDICTOR 12% AVERAGE MONTHSet to 4h
MATIC works best instead of btc
set 1,0 TP
set 1,5 SL
Long and short
12% AVERAGE MONTH
easy

MATIC is Approaching An Interesting ResistanceHey Traders, in today's trading session we are monitoring MATICUSDT for a selling opportunity around 0.5830 zone, MATICUSDT is trading in a downtrend and currently is in a correction phase in which it is approaching the trend at 0.5830 support and resistance area.
Trade safe, Joe.

MATICUSDTmy entry on this trade idea is taken from a point of interest BELOW an inducement.. I extended my stoploss area to cover for the whole swing as price can target the liquidity there before going as i anticipate.. just a trade idea, not financial advise...
Matic Is goodthe weekly chart of matic shows that the low-risk price is around 0.45 to 0.46$ and the best time for buying it is september to december of this year.the classic target is 12$ that it can reached by a year or a year and half.

MATIC NETWORK FED WILL CAUSE BIG CRASHBlackrock CIO already mentioned hours ago that FED wil hike the rates.This is panicing themarkets..and it is just the beginning. Entries and Take profit levels see on chart above

matic sell side There is liqudity present downside so market will move downside to sweep tht liqudity

MATICUSD - Strong Horizontal Support LevelExcluding the low at the labels price .31, MATIC has reached a strong horizontal support level that has seen bounces off it repetitively.
As I think we are entering a larger bull market this could be a great entry point for the bulls.
Simple Support Analysis.
Daily Chart.

MATIC: Superhero of EthereumWe find ourselves at the end of the road fellas. It's pretty simple actually.
1. We break up soon and enjoy a nice alt season
2. We break down and all hell breaks loose
Stay safe, make sure to set stop loss and may the lord have mercy.
Non financial advice.
BINANCE:MATICUSDT

MATIC Weakness: 2-Year Pennant BROKENAfter a massive pump last cycle, MATIC is one of the weaker bigger alts on the market. It has given away all of the gains made since the October 2023 bull move and is not looking like it will stop dumping. The pennant pattern that has been holding for over 2 years has been broken.
I'm looking at the yellow area for a potential long-term entry. Patience is key.

MATIC Network AnalysisMATIC not only performed exceptionally well in the previous bull market but also held up strongly compared to other altcoins in the bear market. I consider $0.37 as the main support level, with ultimate targets of $3 and $10. DYOR

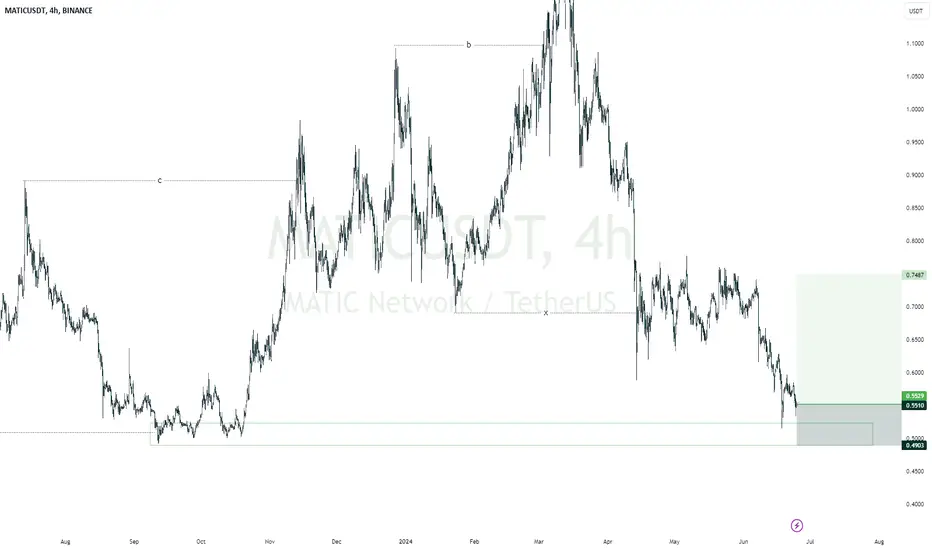
✴️ Polygon (MATIC) Lower Low 30% Drop Before Bullish WaveNotice how yesterday's session is not that strong—Polygon (MATICUSDT).
Notice how today we have red rather than green.
This level of weakness implies that a new low is likely coming in the following weeks and that is something that we have been expecting and welcome because there will be better opportunities when prices are low.
Imagine buying at the market bottom and enjoying GREEN/Up for the entire 2024/25 bull-market. As soon as you buy, prices grow.
👉 For this to be possible patience and experience is needed and of course, we have to wait for the correction bottom low.
Q: How do we know that the market is moving lower?
A: We do not know.
What we know is what the chart is saying now... The market has been moving down since 13-March and this down-move seems to be reaching its end, according to what the chart has to say.
👉 Remember, if you are a beginner, you can just hold and buy more once support is reached.
For beginners, the best course of action is "buy and hold." That is, buy and if somehow you made a mistake just wait and buy more each time prices drop. This is how I personally do it for long-term success and gains. This is not financial advice of course and you need to do your own research.
The reason why you need to do your own research is because of the risk; money can be lost. If you lose money, that is your responsibility because you did the clicking, you made the decision. Here we all share information freely yet we are all adults.
Keep in mind that the market can quickly reverse and move up rather than go down and I can be completely wrong, this happens all the time.
We are reading the charts and using our knowledge and experience to make predictions. Sometimes we simply translate what is written on the chart.
Sometimes we get it right, other times we get it wrong.
All the professional traders in the world will easily tell you that the true winners are not those that have a 90% success rate but rather those that have a winning strategy and those that know how to take a loss.
... More?
Leave a comment and I shall expand.
Thanks a lot for your continued support.
Namaste.
MATIC - Ranges overview (update) Here is a quick look at the current pa on MATIC.
As we noted last time, IF we fail to break and hold above 0.75$ expect us to trade back towards the sellside liquidity resting around 0.5835$
We got the bearish move so let's see where the market wants to go from here.
IF we fail to reclaim the highs expect further pa to the downside.
IF we reclaim and hold expect us to head towards 1.1710$
Be PATIENT and let the MARKET COME TO YOU
Stay safe and never risk more than 1-5% of your capital per trade. The following analysis is merely a price action based analysis and does not constitute financial advice in any form.

Can we get a golden opportunity soon?So there are a few things that I noticed, and it could be a great opportunity to consider either SPOT or FUTURES trading. As you can see BINANCE:MATICUSDT was holding an uptrend channel it has been a good support since June 2022. Looks like it is breaking down which is a very bad sign to go down further, but there is a major support zone at 0.3-0.35 area. This support zone must hold it otherwise we might even see a 0.05 area. The closing candle around 0.485 will be 3rd BOS (break of structure), and confirmation to continuously
go down. I will consider Long trade around 0.3-0.35 area.

15min MamticLooks Bearish for a nice short scalp to the downside. expect all vector zone to clear on the way to the golden pocket fib. Lots of confluence here

MATIC IS AT CRUCIAL SUPPORTMatic is trading at a crucial support level and needs some buyers to come in or we can move much lower. Great area to DCA and hold if you believe in this company long term.
Calculate Your Risk/Reward so you don't lose more than 1% of your account per trade.
Every day the charts provide new information. You have to adjust or get REKT.
Love it or hate it, hit that thumbs up and share your thoughts below!
This is not financial advice. This is for educational purposes only .
