#MAVUSDT Ready for a Bullish Breakout or Deeper Correction? Yello Paradisers! Are you ready to catch the next big move in #MAV? Let's look at the latest analysis of the #MaverickProtocol:
💎We've been closely watching #MAVUSDT within a descending channel for some time, and it's now flashing signs of a bullish breakout. Currently, we are seeing a bullish continuation from a key demand zone at $0.159.
💎If NYSE:MAV maintains support at the current demand zone, we could witness a significant bullish rally reminiscent of past trends. A breakout above the resistance at $0.411 might pave the way for a move toward higher resistance levels.
💎If the momentum fails to sustain, the next bullish rebound could occur around the lower support range of $0.116-$0.128.
💎But remember, Paradisers, stay vigilant! A daily close below the demand area could negate this bullish outlook and potentially trigger a deeper correction.
Trade smart, stay disciplined, and be patient—this is how we stay ahead
MyCryptoParadise
iFeel the success🌴
MAVUSDT trade ideas

MAVUSDT Bearish Breakdown and Correction TargetMAVUSDT recently broke down from a rising wedge pattern, initiating a corrective phase. Since the breakdown, the price has been steadily declining. This downward movement is anticipated to persist, with the price expected to reach the final bear target illustrated on the chart.
We should monitor key support levels during this correction and be prepared for a potential trend reversal once the projected target is achieved. The current price action suggests continued bearish pressure in the short term.

MAV breakoutWith buy and aggressive Fbuy triggering on 7-star, we can reach the listed targets. More confirmation needed with greater volume for this trade to achieve. Keep eye on the volume. DYOR
for early entries contact us for the resorces.

Mavusdt trading opportunityMavusdt is transitioning from a potential rounding bottom reversal pattern, with the price successfully breaking above the neckline.
Presently, the price is consolidating within an ascending channel. We have identified a promising demand area to monitor closely, along with the final setup targets.
Additionally, we have specified the stop-loss region to observe. Please exercise caution and trade responsibly.
Your feedback and support through comments and likes on this analysis are highly appreciated.

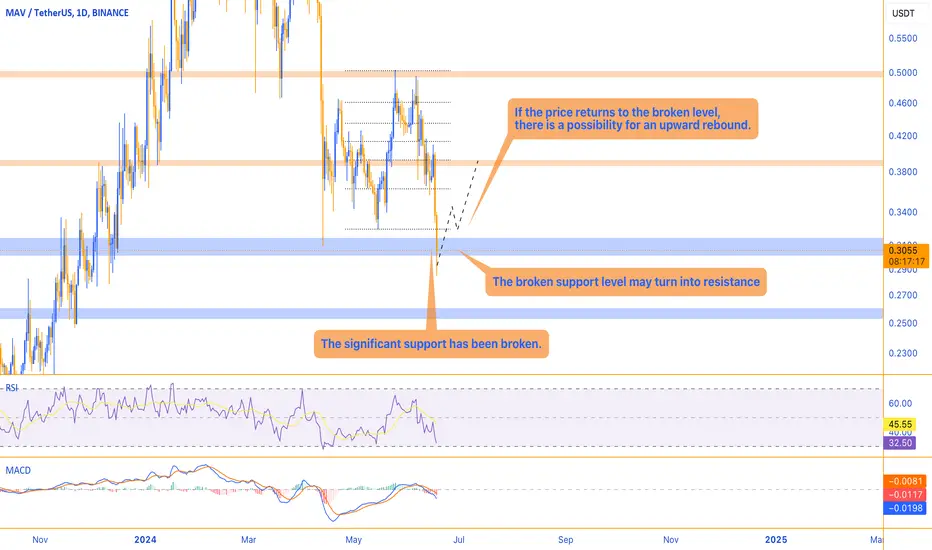
There is a possibility for the price to rebound upwardsIn the daily timeframe, the overall trend of MAV is bearish, and the price is sharply declining. As you can see on the chart, the price has broken its support level, which now has the potential to turn into resistance. If the price returns to the broken level and the breakdown proves to be false, there is a possibility for the price to rebound upwards.
MAV Bullish Channel ReversalJust like my recent CYBER analysis, MAV is trading within a bullish channel. I'm anticipating that the low is in (for now) and that the most likely path forward would be a continuation of the trend.
Target at the top of the channel or 1.25$, stop below the recent swing lows.

MAVUSDT Long Setup!MAVUSDT technical analysis update
MAV price is breaking out of its triangle pattern on the 4-hour chart; we can expect a 30-50% move from the current level.
Buy zone : Below $0.375
Stop loss : $0.337
Regards
Thanks

MAVUSDT set to go SHORT?EnF Breakout Strategy signaled a SHORT on MAVUSDT
See idea for breakout entry, targets and stoploss
Only enter the trade when the price break down below entry
Check out more on the script:
To get access to this script, DM me

MAVUSDT Inverse Head & ShouldersMAVUSDT
Inverse Head & Shoulders pattern. Price retested neckline and is holding above EMA200.
SL: 0.356

Update MAVMany times I have written about the MAV coin and continue to do so because this asset has not yet completed its movement structure. Therefore, I have decided to update the idea and overlay a similar fractal that fits perfectly into this concept.
Recently, I also published a detailed post where I outlined the Maverick Protocol project, its core principles, and potential advantages. If you missed this post, I recommend reviewing it to better understand why I am so excited about this project.
The calmness and stability of its movement continue to be key success factors) 😜

Maverick Protocol (MAV) completed a setup for upto 26% pumpHi dear friends, hope you are well and welcome to the new trade setup of Maverick Protocol (MAV) with US Dollar pair.
Recently we caught almost 27% pump of MAV as below:
Now on a 4-hr time frame, MAV has formed a bullish BAT move for the next price reversal move.
Note: Above idea is for educational purpose only. It is advised to diversify and strictly follow the stop loss, and don't get stuck with trade.

MAV LONG SETUP & ANALYSIS FOR NEXT WEEKMAV is trading in rectangular frame for more than 100 days, so pump is highly expected from this zone. Low leverage and spot calls are expected from traders.


MAV/USDT IDEA Mav/Usdt has recently shown signs of breaking out above the trendline resistance, indicating a potential bullish rally ahead. This breakout could potentially lead to a significant upward movement in the price, with a target towards the $1 level. However, it is important to note that this information is not financial advice, and individuals should conduct their own research (DYOR) before making any investment decisions.
The breakout above the trendline resistance suggests a shift in market sentiment towards a more bullish outlook for Mav/Usdt. If the breakout proves to be successful, we could see a strong momentum driving the price higher towards the $1 mark. Traders and investors may find this development as an opportunity to capitalize on the potential price appreciation.
It is crucial to consider various factors such as market conditions, trading volume, and overall market sentiment before making any trading decisions. Additionally, risk management strategies should be in place to mitigate potential losses in case the breakout does not sustain its momentum.
In conclusion, while the breakout in Mav/Usdt looks promising for a bullish rally towards $1, it is essential to conduct thorough research and analysis to make informed investment decisions. Stay updated with the latest market developments and be prepared for various possible outcomes as the situation evolves.

MAV after the pullback will continue to go downMAV after the pullback will continue to go down
🔵Entry Zone 0.6428 - 0.6190
🔴SL 0.6646
🟢TP1 0.5491
🟢TP2 0.5036
🟢TP3 0.4341
Risk Warning
Trading Forex, CFDs, Crypto, Futures, and Stocks involve a risk of loss. Please consider carefully if such trading is appropriate for you. Past performance is not indicative of future results.
If you liked our ideas, please support us with your likes 👍 and comments.

MAV looks bearishConsidering the bearish CH and liquidity pools at the bottom of the chart, it seems that MAV intends to move towards the specified demand.
Also, the trend line is lost.
supply is a good place for sell/short positions
By maintaining the supply range, it can drop the demand side.
Closing a daily candle above the invalidation level will violate this analysis
Note that the financial market is risky, so:
Do not enter any position without confirmation and trigger.
Do not enter a position without setting a stop.
Do not enter a position without capital management.
When we reach the first TP, save some profit and try to move the stop continuously in the direction of your profit.
If you have any comments please post them, comments will help us improve our performance
Thanks


MAV: sell in breakeven📊Analysis by AhmadArz:
🔍Entry: 99.41
🛑Stop Loss: 104.15
🎯Take Profit: 94.97 - 91.39 - 87.95
🔗"Uncover new opportunities in the world of cryptocurrencies with AhmadArz.
💡Join us on TradingView and expand your investment knowledge with our five years of experience in financial markets."
🚀Please boost and💬 comment to share your thoughts with us!

i feel something big hereAll indications are for massive bullish movement on this MAVUSDT pair, wait for retracements and enter trade around 11:00am tomorrow NYC

Alikze → #MAV | The bottom of the ascending channelAfter touching the target, according to the analysis of the previous post ( here ), it is currently moving in an upward channel, which is placed on the support of the previous ceiling and also at the bottom of the channel. If it registers a green candle above 65 cents and exits the corner of concentration, the first target of that supply zone will be the range of 78 cents, and then, if the supply zone breaks, its next target will be 87 cents.
🟩Sup: 0.65
⛳️Tp 1:0.78
⛳️ Tp2 :0.87
-----------------
Please support this idea with a LIKE and COMMENT if you find it useful and Click "Follow" on our profile if you'd like these trade ideas delivered straight to your email in the future.
Thanks for your continued support.
Sincerely.❤️

MAV-USDT Swing Trade Signal @ $1.13 (50% Profit) Ticker: MAV-USDT
Target: $1.13
Timeframe: 2-3 weeks or less
MAV-USDT has been on a steady growth since the previous cryptocurrency low in October 2023 going up over 300% and following an extremely bullish wave.
A lot of cryptocurrencies have gone down since then and are now recently experiencing those shorter term big pumps that will eventually grow bigger as Bitcoin's halving date approaches and many other cryptocurrencies follow suit to the overall bullish trend.
The only way that you can miss out on a 100% gain this cryptocurrency halving season is if you are trading overly leveraged assets, or placing capital in cryptocurrency assets that are too small, abandoned, or are overall rug pulls and scams (riskier trades with low credibility)
However, while it is as certain as can be with cryptocurrency that most bigger cryptocurrencies that were successful last halving date will continue to be successful (with the exception of scams and rug pulls like Luna and other failed projects), and will hit their previous all time high or above (assuming that no significant amount of supply has changed), that doesn't mean there aren't shorter term opportunities.
My reasoning behind MAV-USDT going up 50% within the next 2-3 weeks (or sooner) is based on a few technical and fundamental factors.
Technical: The overall technical trend meter of this company has recently entered into the bullish realm and price action is overall very bullish. This indicates that pressure is building and a big move will happen soon.
Fundamental: Price has recently gone up and average 10 day volume is at a lower point then the other average volume time frames, indicating that order book flow is changing to allow for a big movement on the upside and that when volume explodes price will follow. This in accordance to the technical price action indicates higher upwards pressure.
There has been a lot of outflows for both Bitcoin and Ethereum recently, indicating that higher cap coins are being moved out of exchanges and being put into alt coins. Ethereum has decreased in market dominance while Bitcoin has increased, and this in connection to the outflows and large transactions of Ethereum and Tether indicates that money will continue to move out of high cap coins and into alt coins on other exchanges.
Now these factors on their own isn't enough to indicate a signal such as the one I am describing, however with the fundamental factors that are in current public knowledge and MAV-USDT's price action, overall bullish trend, and other technical factors, I would say its a safe bet that this cryptocurrency will see a big move fairly soon. Feel free to check out my previous posts on TradingView, I have had a pretty good track record of finding big movements in the cryptocurrency space, not so much with stocks and options though. I don't delete any of my posts so there are winners and losers, I just hope that with my insights and yours you can take away your own opinion and potentially benefit from the shared information.
DISCLAIMER:
THIS IS NOT FINANCIAL ADVICE AND IS STRICTLY FOR INFORMATIONAL PURPOSES ONLY, THERE IS INHERIT RISK WITH FINANCIAL DECISIONS AND THE CREATOR OF THIS POST WILL NOT BE HELD ACCOUNTABLE FOR ANY LOSSES.

MAV 1$Today, I want to share with you a fresh perspective on MAV, which seems to be slowly but surely moving along an upward trend.
Analyzing Opportunities:
After careful analysis, I've identified an interesting zone for a potential entry - the $0.5-$0.6 range. The price has shown a reaction here more than once, making this zone attractive for consideration.
Entry Strategy:
We're considering an entry after a retest of the trend line. This could be your point for a potential entry, given the current attempts by the market to build an upward trend.
My Observations:
I've mentioned this coin in my posts multiple times and believe that its movement has not yet finished. There are all reasons to expect the trend to continue.
An Important Note - Risk!
Let's not forget about the risks. The market is not a place where everyone can make money. It's important to adhere to a risk management strategy and remember why we are here.

MAV Bulls Charge: Support Bounce & Stochastic RSI Signal!
NYSE:MAV finds support at $0.60 and Stochastic RSI flashes a bullish cross-up! To keep the momentum, it needs to break and hold above $0.6464. Bitcoin's surge to $50k adds fuel to the altcoin fire. But watch out, a drop below $0.57 invalidates the trade.
#MAV #CryptoTrading #SupportBounce #StochasticRSI #Altcoins #Bitcoin
