Gold LongsFollowing last weeks bias. Looking for REQH target.
Want to pair longs with a weekly profile. Ideally Monday or Tuesday creates the low of week. Will look to get onside with longs once theres a clear intraweek reversal. Trade the continuation higher. A close below 3320 is invalidation. Expecting previous week low to be protected and expansion to the upside
Gold Mini Futures
GOLDM1! trade ideas

Trapped orderflow. Gold Weekly Outlook. 19.07.2025,SaturdayExpecting a range bound market condition until any one of the VI on the weekly inverse. Trapped Orderflow

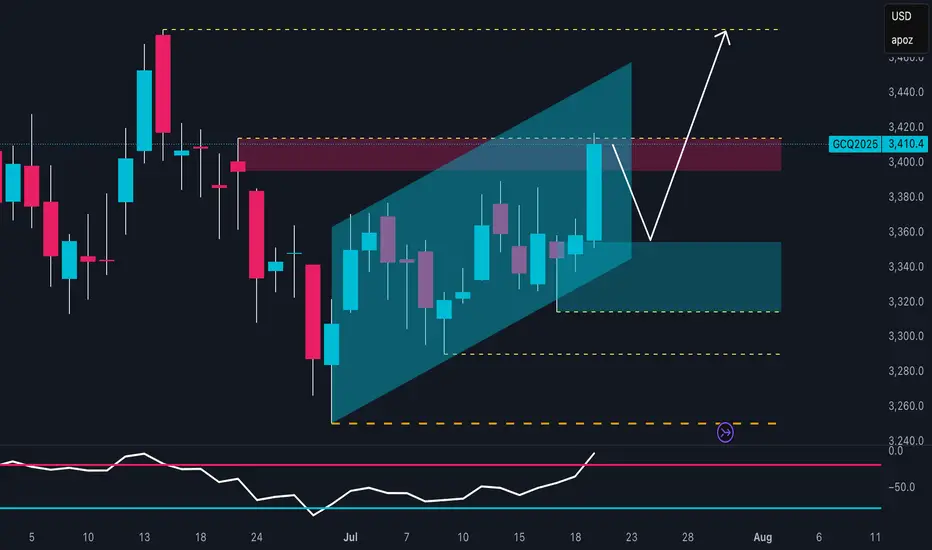
Gold Bulls Reloading? Smart Money Buys!The technical outlook on XAU/USD shows a well-defined bullish trend, developing within an ascending channel that started in late June. Price recently pushed toward the upper boundary of this channel, reaching a key resistance zone between 3,410 and 3,420 USD, which aligns with a previous supply area and significant daily structure. The reaction in this zone suggests a potential fake breakout, hinting at a short-term pullback before a continuation of the upward move.
The RSI oscillator supports this view, displaying bullish momentum with a breakout above the 60 level. However, the current slope hints at a possible minor correction before the next impulsive leg higher. The most relevant demand zone lies between 3,340 and 3,360 USD, at the base of the ascending channel—an ideal spot for buy orders to accumulate in anticipation of a move toward previous highs.
Backing this technical setup, the Commitment of Traders (COT) report as of July 15, 2025, paints a constructive picture. Non-commercial traders (institutional speculators) increased their long positions by over 8,500 contracts, while also cutting short positions by about 1,600 contracts, indicating a strong bullish bias. Commercials also increased their shorts (+16,448), a typical hedge during rallies, but not enough to invalidate the bullish structure.
From a seasonal perspective, July remains one of the historically strongest months for gold. According to MarketBulls data, over the past 2 years, gold has averaged gains of 105+ points in July, with solid returns also visible on the 5-year (+45 pts) and 10-year (+25 pts) averages. August also tends to be supportive, reinforcing the idea of a medium-term bullish extension.
Lastly, the retail sentiment is heavily skewed, with 72% of retail traders short, and only 28% long. From a contrarian standpoint, this is another strong bullish signal. When the majority of retail traders are short in a structurally bullish market, the potential for a short squeeze remains high.
Gold [GC1!] 21.07.2024COMEX:GC1!
Daily Orderflow. Asian Range Displacement and London Expansion New York Continuation. Rare expansion day when all three sessions shows one-sidedness

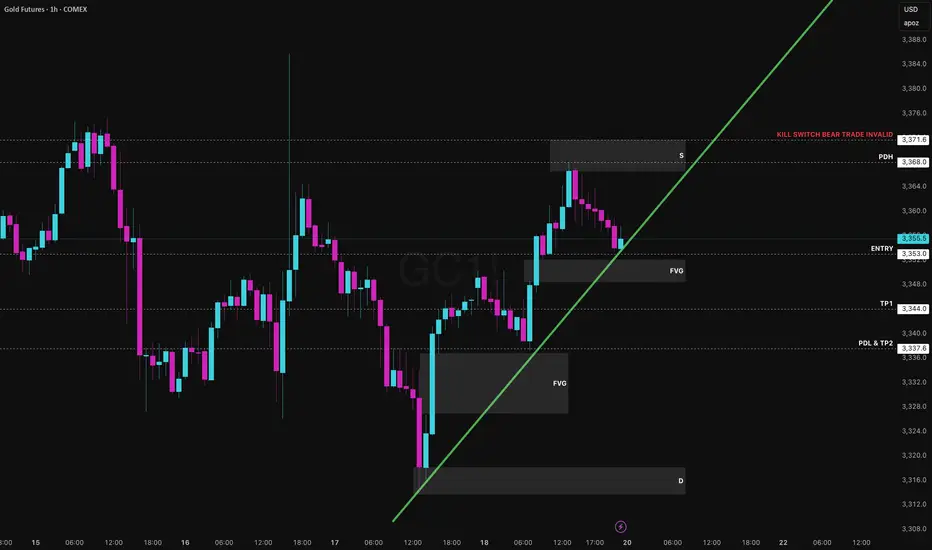
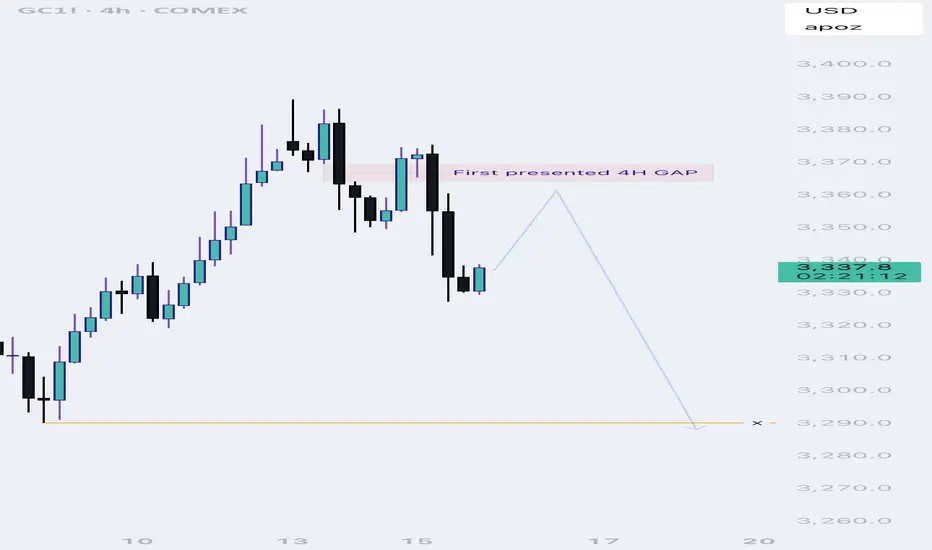
GC Ready to Bleed? This Setup Has Teeth.As we head into the new trading week, GC presents a clean, disciplined short setup developing right below Friday’s key high. Price tapped the Previous Day High ($3,368) and supply zone before rejecting, failing to hold bullish momentum into the weekend close.
The market structure is currently defined by:
- A strong upward trend line (supporting the latest rally)
- A bearish order block/supply zone
- Two Fair Value Gaps below
- A failure to sustain above PDH
This confluence builds a narrative of exhaustion to the upside, especially with no aggressive buyers stepping in after PDH was swept. We're not short yet this setup needs confirmation. But once it breaks, it's clean.
Entry (Trigger) - $3,353.0
A clean break below the ascending trend line, ideally with a 1H close through it. This confirms structure shift and bearish intent.
- TP1: $3,344.0 → Top of the unfilled FVG zone
- TP2: $3,337.6 → Previous Day Low (PDL) and liquidity target
Kill Switch (Invalidation Level) - $3,371.6
If the market opens strong and pushes through the PDH and supply zone, the short idea is invalid. No shorts above here.
Confluences
- PDH Rejection - Strong wick and reversal from $3,368 shows supply dominance.
- Trend line Weakness – Price stalling right at the trend line heading into open. Any gap down or weak open will break it.
- FVG Below – Unfilled inefficiency sitting directly beneath current price this is a natural magnet.
- Volume & Momentum Divergence – Last push into highs had lower volume, suggesting buyer fatigue.
- Time-Based Edge – Sunday night liquidity traps often lead into London session reversals ideal timing for trend line break & FVG sweep.
- Clean Invalidator – No ambiguity: reclaim the highs = setup is off.
Timing & Execution Plan
This is not a trade to rush into at Sunday open. We want the 1H candle to close below $3,353.0 or a rejection + retest structure. The key sessions to monitor are:
- Sunday Night (Low Liquidity) - Observe gaps or traps
- London Open (8:00–9:00 UK) - Look for momentum or stop run
- NY Open (13:30 UK) - Final confirmation if London doesn't move it
Only act on confirmation. No guesswork. No front-running. Let the setup play out. If the market opens strong and climbs above $3,371.6, we’re no longer looking short. In that case:
- Supply zone is invalidated
- Trend line is reclaimed
- FVG becomes invalid magnet
We stand aside and reassess the long side on intraday demand reclaims or wait for a deeper correction to re-engage. This setup is a textbook bearish, high-probability, low-risk, confirmation-driven. It has everything we look for: structure break, inefficient price gap, prior liquidity sweep, and a defined invalidation. All that’s left is for the market to open and print.
If it confirms, it moves fast.
Longing GoldWell, it does look like a good long trade in here.
My confidence is moderate in this trade.
I would say 4 out of 10, this could hit. personally iam going to take this trade but will be more cautious with the amount of contracts that i will be putting on the line.
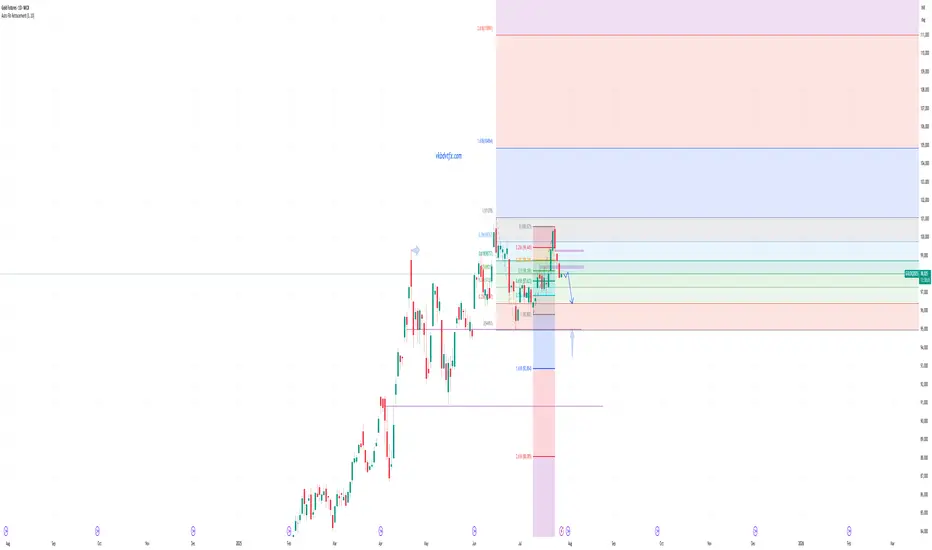
High probability that gold will fallHello,
I hope you're doing well. Here, I'm sharing my analysis of the gold futures market.
Now I see that there's a good chance, about 80%, that it will fall.
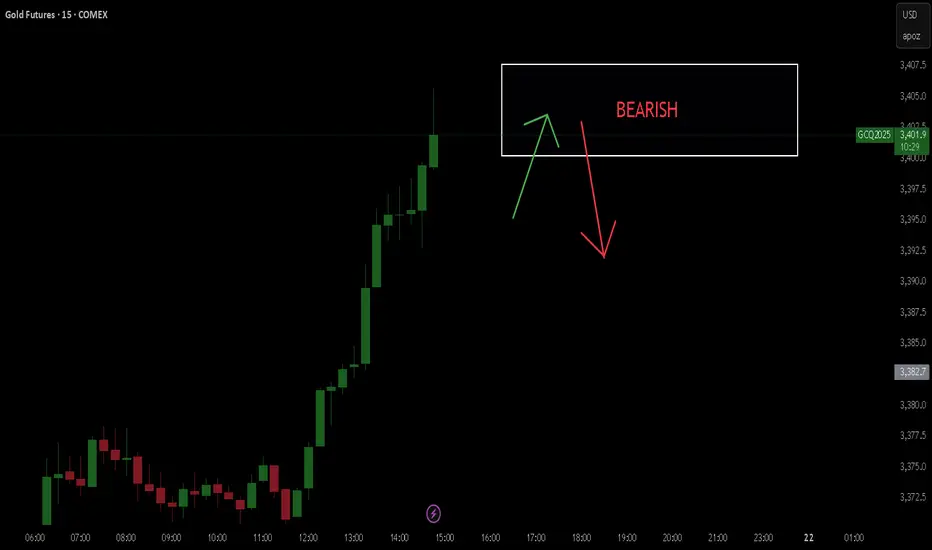
Gold. 14.07.2025. The plan for the next few days.The nearest resistance zones are where it's interesting to look for sales. It's not certain that there will be a big reversal, but I think we'll see a correction. We're waiting for a reaction and looking for an entry point.
The post will be adjusted based on any changes.
Don't forget to click on the Rocket! =)

GOLD: Pre-market PrepSo for gold today, I see a lot of confluence around the prior week's high, prior day's high, and the prior value area high. We also had a poor high last Friday that we've clearly broken through.
Right now, we're in balance up above these key levels. My immediate plan is to continue going long up to the prior month's value area high. If we get a pullback to the confluence area, I want to take it up from there.
If the market opens and we accept back into the previous area, I'll be looking to go short from that area and take it down. That's my main analysis for gold today. Let’s trade smart, peace!

GOLD! Pre-Market Analysis For Friday July 18th!In this video, we'll present pre-market analysis and best setups for Friday July 18th.
Enjoy!
May profits be upon you.
Leave any questions or comments in the comment section.
I appreciate any feedback from my viewers!
Like and/or subscribe if you want more accurate analysis.
Thank you so much!
Disclaimer:
I do not provide personal investment advice and I am not a qualified licensed investment advisor.
All information found here, including any ideas, opinions, views, predictions, forecasts, commentaries, suggestions, expressed or implied herein, are for informational, entertainment or educational purposes only and should not be construed as personal investment advice. While the information provided is believed to be accurate, it may include errors or inaccuracies.
I will not and cannot be held liable for any actions you take as a result of anything you read here.
Conduct your own due diligence, or consult a licensed financial advisor or broker before making any and all investment decisions. Any investments, trades, speculations, or decisions made on the basis of any information found on this channel, expressed or implied herein, are committed at your own risk, financial or otherwise.

Gold Futures Trading Plan / July 21, 2025Overview
This trade plan reflects a comprehensive view of gold futures (GC) going into the week of July 21, 2025. The analysis draws from current macroeconomic factors, positioning data, technical structure, and live order flow behavior. Every component has been evaluated to ensure the bias is not emotional or speculative but firmly evidence based.
Macro Environment
• Real US 10Y TIPS yields remain above 2.00%, historically a bearish regime for gold.
• The US Dollar Index (DXY) is firming, adding pressure to metals.
• Absence of geopolitical or systemic financial stress weakens safe-haven demand.
• The Federal Reserve maintains a hawkish tone, with no near-term easing signaled.
Positioning Overview (as of July 15, 2025)
• Funds: Net long ~213,000 contracts, increasing their long exposure.
• Commercials: Net short ~250,000 contracts, adding to short exposure.
• Retail: Net long ~37,000 contracts, aligning with fund sentiment.
This positioning suggests a crowded long environment with commercial hedging at elevated prices. Historically, such divergence has preceded local reversals in gold.
> Commercials are unloading gold to the euphoric buyers
>Retail is joining long side = late to the party
Funds are late, commercials are patient. If we break higher and fail, that’s my cue to fade.
Demand & Flows
• India: Gold imports declined to a 14-month low in June.
• China: Volume at the Shanghai Gold Exchange remains stable but subdued.
These indicators reflect softness in physical demand from key global buyers.
Technical Snapshot
• Price is compressing within 3330–3375.
• Point of control (POC) near 3358.
• Repeated rejections near 3375 with weakening volume.
• Negative divergence seen in cumulative volume delta (CVD).
Order Flow Observations
• Absorption noted near 3365–3380, with price stagnation despite aggressive buying.
• Lack of delta follow-through into highs.
• Spoofing behavior detected around 3372–3375, consistent with trap formation.
Trade Thesis
This is a macro-aligned short idea based on positioning, absorption at resistance, and weakening momentum into overhead supply.
Execution Framework (example scenario)
This is a non-binding conceptual entry framework for educational purposes only.
• Initial scale-in: ~3367.5 (light test)
• Main entry zone: ~3371.5 (if absorption continues)
• Optional add-on: ~3374.5 (if spoofing holds and no breakout occurs)
• Risk: Hypothetical invalidation above ~3385.5
• Targets:
• T1: ~3348 (value area)
• T2: ~3332 (prior support)
Note: Actual execution must depend on real-time confirmation and discipline. This example is not financial advice or a live signal.
Sentiment Bias
Currently biased short if price fails to break 3375 with conviction. Trade invalidates on sustained strength through absorption zones.
Probability: High
Gold.. in the fog of global chaosNotes:
Markets for metals are at a ATH.
Global events are evolving rapidly.
Most of the time, war=raging gold prices
Markets are ripe to retrace and or maybe reverse at all. Taking setups on gold with a grain of salt.
Gold is an event driven market. I expect for now a consolidation until bearish signals show.
Gold is Setting up for another moveLooking for price to make some impulsive moves before we get active. Looking like they are trying to establish a low for the week before they go full on bullish. waiting for them to find that bottom.

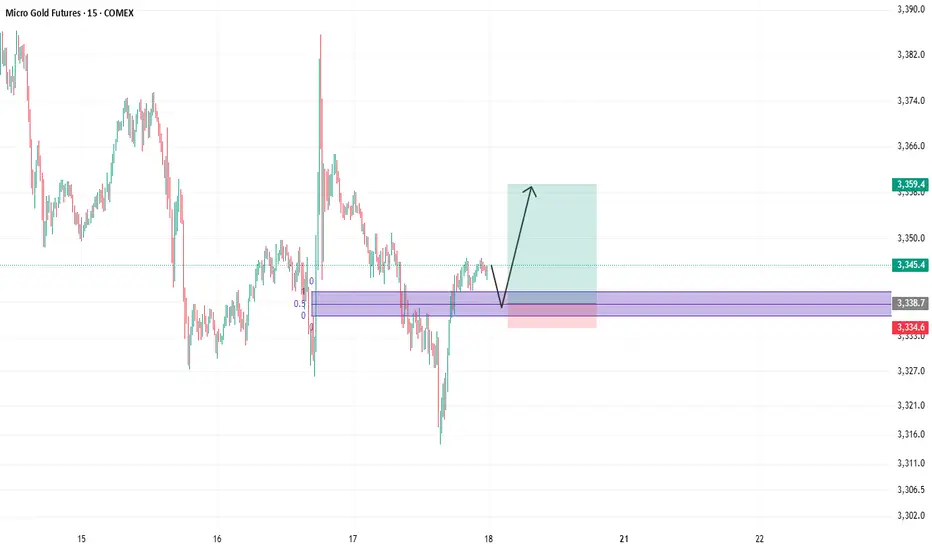
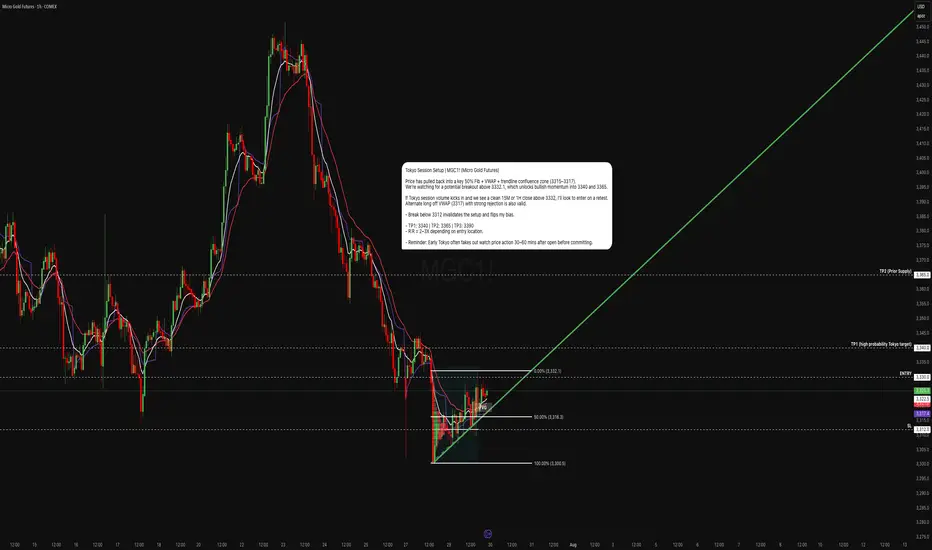
Gold’s in the Chop Shop. Tokyo’s Got the KeysGold has entered a key decision zone ahead of Tokyo. After a controlled retracement off the 3332 swing high, price has now compressed into a high-probability confluence pocket:
- 50% Fibonacci retracement (3316.3)
- VWAP acting as dynamic support (~3317)
- Trend line support holding from prior structure lows
- Compression below 3332.1 the breakout gate
If Tokyo volume engages, this could trigger a clean structural breakout into higher liquidity zones.
Primary Entry:
- Trigger: 15M or 1H candle close above 3332.1
- Entry Range: 3333.0 – 3334.5 on retest confirmation
- Stop Loss: 3312 (below trend line + VWAP)
Aggressive Entry (Mean Reversion):
- Bounce off VWAP/Fib zone (3316–3317.5) with bullish reaction
- Tighter SL: 3312–3314
- Lower R:R, but better pricing
Target Zones:
- TP1 3340 Minor resistance & round number
- TP2 3365 Prior breakdown zone / supply
- TP3 3390–3400 Extended Tokyo move + trend reversal territory
If I'm Wrong:
A breakdown below 3312 invalidates the bullish thesis. That would signal VWAP failure, trend line break, and potential reversion to 3300 or lower.
Technical Confluence Checklist:
- VWAP support holding - Complete
- 50% Fib bounce attempt - Complete
- EMAs compressing for potential crossover - Complete
- Clean trend line structure intact - Complete
- Low volume chop zone between 3312–3332 - Caution
Tokyo often fakes the initial move. Ideal trigger confirmation comes 30–60 mins after Tokyo open, once liquidity builds. Watch for manipulation wicks around VWAP before committing.
This is a classic quant compression setup, price is coiled into structure, and all major intraday tools align. If we see a clean move above 3332 with volume, the breakout could unfold fast. But lose VWAP and trend line, and the bias flips instantly.
Stay reactive, not predictive. Let price prove direction.
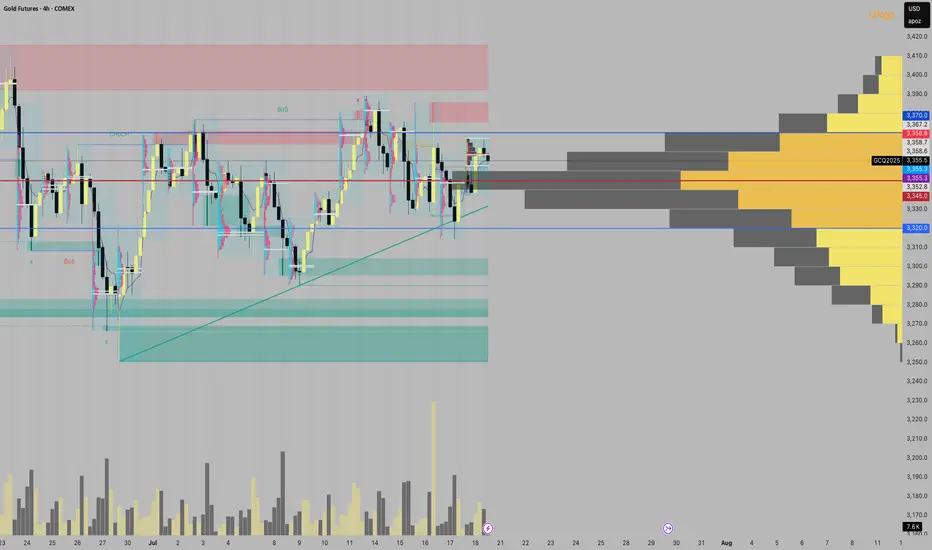
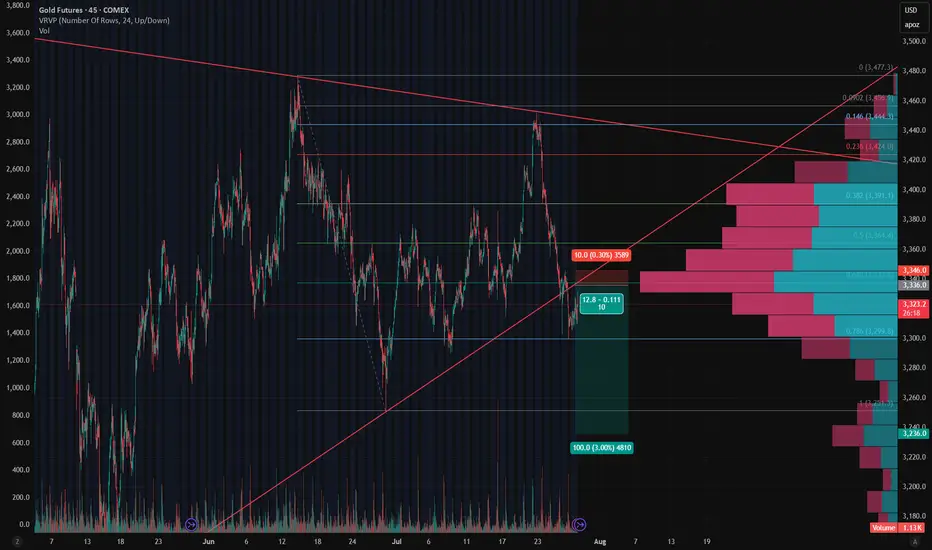
Gold - Short Setup Off Major Trendline Rejection📉 Gold - Short Setup Off Major Trendline Rejection
Gold has broken down through the rising trendline and is now retesting it — the moment of truth! 🧐
🔻 Short Entry: 3,336
🎯 Target: 3,236 (Fib 1.0 + HVN gap fill)
🛑 Stop: 3,346 (Above trendline retest)
⚖️ Risk/Reward: ~1:10
📊 Bonus: High volume node above adds resistance. Bearish volume profile structure confirms the breakdown bias.
Watching for volume to pick up on the move down. Let's see if GC bleeds into August. 🩸📆
GOLD MCX BULLISH VIEWAfter 4 days continuous down side Some pullback relief expected till 99000. Tested trendline near support zone of 96900 and supply zone near 98200-98500-99000
Please do your own research before taking any trading decisions
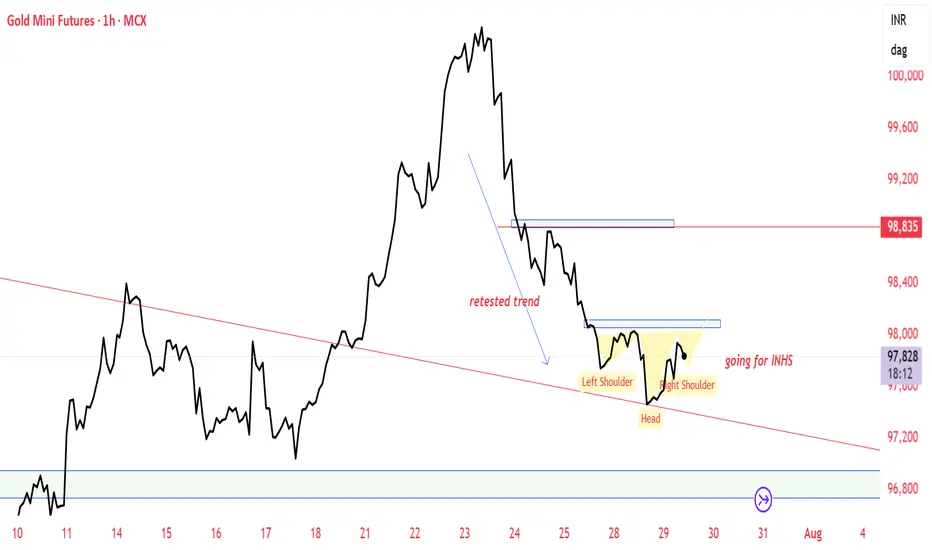

mcx future gold price moving we are prepare technical chart upcoming price expected down 98100 R
97890, 97690, EXPECTED S1 & S2
GOLD - GC Weekly Recap & Outlook | 27.07.2025🧾 Weekly Recap:
• Price tapped into the 1H Demand Zone (red box) and ran the 4H swing liquidity before bouncing to clear internal range liquidity.
• This move was followed by a retracement which led to a break of the bullish trendline.
This may signal the beginning of a broader accumulation phase. Expect choppy price action targeting internal liquidity both above and below, before a clear trend resumes.
📌 Technical Analysis:
Price has closed below the bullish trendline, leading to two possible scenarios:
1. Bullish scenario (black path):
– Price runs the W C DOL (3313$) →
– Finds rejection →
– Retests broken trendline →
– Breaks above the trendline →
– Continues toward 3444$ and potentially 3474$
2. Bearish scenario (orange path):
– Price runs W C DOL (3313$) →
– Rejects from the broken trendline →
– Fails to reclaim it →
– Continues downward to target M C DOL (3256$)
📈 Setup Trigger:
Wait for clear 1H–4H supply/demand zone creation and structure shift before initiating a trade.
🎯 Trade Management:
• Stoploss: Above/below relevant supply-demand zone
• Targets:
– Bullish: 3444$, 3474$
– Bearish: 3256$
🟡 If you liked the idea, feel free to drop a like & comment — and don’t forget to follow for more weekly updates.

Gold. GC1! Weekly Outlook. 27.07.2025, SundayCOMEX:GC1!
Outlining gold on HTF. Waiting for FOMC and NFP

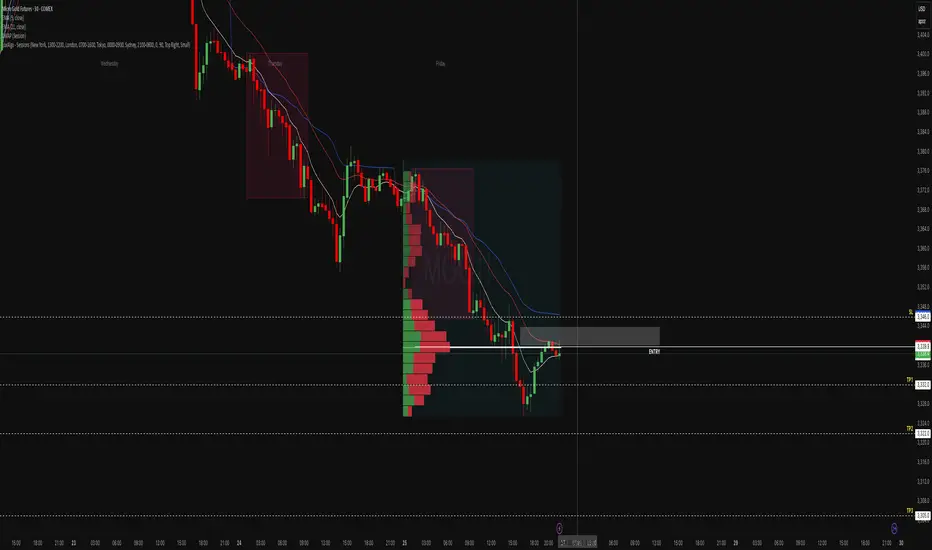
MGC Tokyo Fade: If It Rejects, It DiesThis one was a request from someone asking for a breakdown of MGC heading into the Tokyo session so here’s the full quant review.
After Friday’s clean liquidation, gold found temporary footing around 3330. But the bounce is stalling under VWAP (3344) and Friday’s POC both stacking resistance like a ceiling of bricks. EMAs are fanned and directional, suggesting sellers still control the structure.
VWAP + POC = kill zone for a potential Tokyo fade.
Quant Review:
- Friday Session POC: 3341.9 — currently acting as resistance
- VWAP (Session): 3344.6 — unclaimed on the bounce
- 9 & 21 EMAs: Bearishly stacked, aligned with VWAP
- Volume Profile: Value area is lower; price is rejecting acceptance higher
- Microstructure: Weak bounce into resistance without reclaim of structure
Trade Plan (Short Bias):
- Entry Zone: 3340–3344 (VWAP/POC cluster)
- Trigger: Bearish engulfing or LTF rejection off VWAP shelf
- TP1: 3332 (prior low)
- TP2: 3322 (thin node sweep)
- TP3: 3305 (session low extension)
- Stop Loss: Above 3346 (structure + shelf break)
- R:R: 1.5–5 depending on scaling
- Probability of rejection and drop to 3332: 65%
- Probability of full leg to 3322–3305: 30%
- Risk of breakout above VWAP: 5%
If I’m Wrong
The Sunday open is always a wildcard sometimes you get pure trend continuation, other times it’s total chop or liquidity grabs before the real move unfolds in London.
If price cleanly reclaims 3346, closes above with strength, and holds the short idea is off. At that point, I’d expect a sweep toward 3355–3360, potentially tagging the high-volume node from mid-Friday.
In that case: Flip bias to bullish retrace into early London.
Bonus:
If you ever want a quant-style breakdown or session analysis like this just reach out. We break it down with structure, stats, and setups.
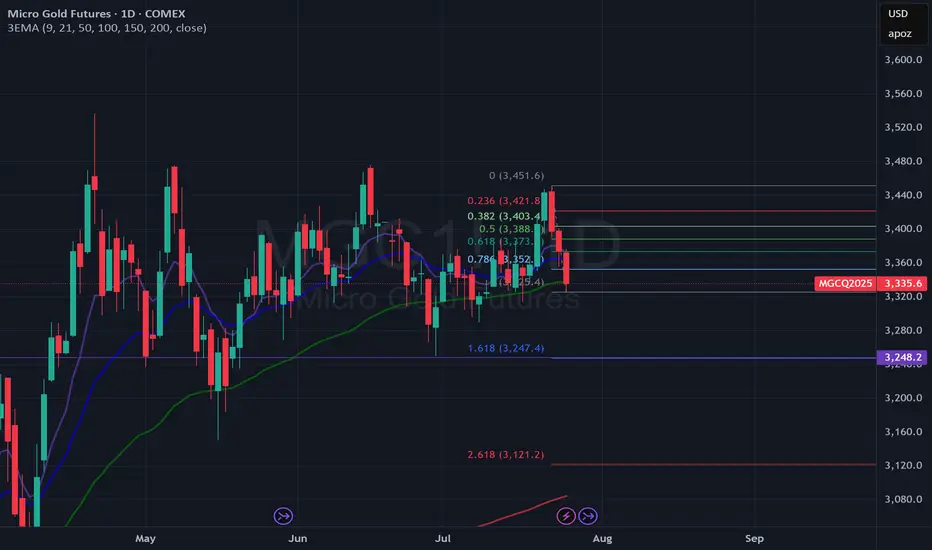
Near Term Bearish Development on Gold?The three bearish days in a row could be a potential near term bearish development on Gold. If a retest somewhere between 3370 and 3400 happens relatively soon and rejects it could potentially be in for a bearish extension. 3373 would be the 0.618 and 3388 would be the 0.5 retracement area. With a potential target down toward 3248 area
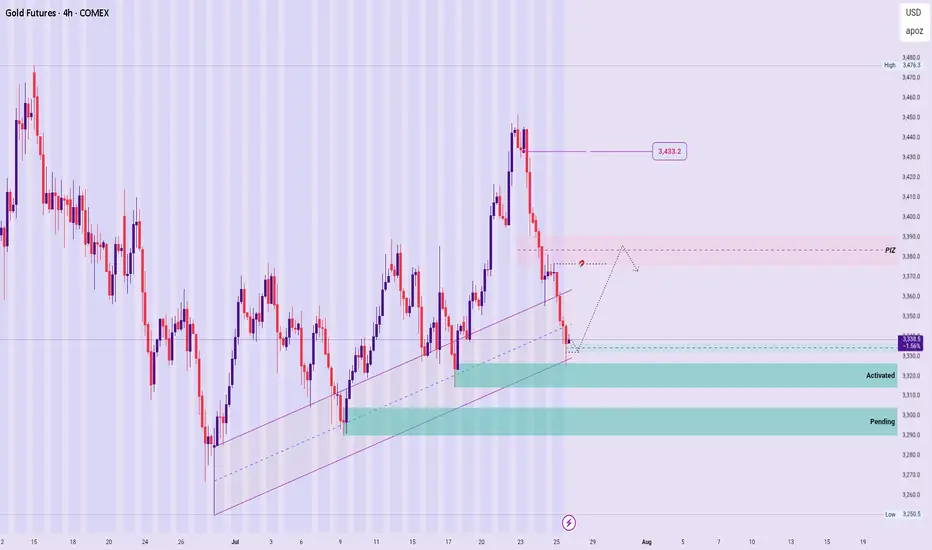
GOLD – New Week Technical Bias (Market Open)
Structural Outlook:
The broader bullish sequence remains valid, with no structural breach confirmed yet.
However, price is currently reacting at a sensitive level, warranting measured caution.
Zone Dynamics :
▪︎ A recently activated Rejection Zone is expected to support a gradual impulse toward the PIZ.
▪︎ From the PIZ, two scenarios unfold:
a. If it becomes a Price Base, we may see a continuation rally toward the 3433.2 region.
b. If the PIZ acts instead as a Price Cap, price may reject lower, targeting the pending Rejection Zone beneath or deeper, should the current zone fail to hold. Thereby presenting a Bearish structural formation.
Summary:
The directional bias remains bullish unless a clear Structure Breach (SB) occurs below key support levels.
Stay adaptive, and observe the PIZ reaction closely for directional confirmation.
🛑 Disclaimer:
This is not a trade signal. These are high-level technical insights meant for educational and analytical purposes. Always validate with your system and trade with discipline and risk awareness.