GC - looking for a possible sell entryI am seeing some of the early breakdown started, but in very early stage and it might take couple of days to play out. I am very much interested interested in selling the GC at around 2665 to 2670 area. There is a chance it may spike up during European or early US session tomorrow. On the downside, 2632 area is a strong support and may hold up and bounce before price going down to 2610 area.
Gold Mini Futures
GOLDM1! trade ideas

#202439 - priceactiontds - weekly update - goldGood Evening and I hope you are well.
tl;dr
gold: Bulls got a clean breakout but they need follow through on Monday/Tuesday. The current channel fit’s nicely but we only know market is respecting it when we see a pullback. If this breakout is strong, bulls would not let the market fall below 2600 again. A weaker trend would pull back to the daily ema around 2600 before continuing. As long as we hold above the daily ema there is a very good chance we will see 2700 next. Small chance this trend is accelerating and breaking above the drawn channel and we would see 3 strong legs up which could lead to 2800.
Quote from last week:
comment: Finally the breakout above and the 2600 print. All bullish targets are now met for me so no interest in buying this high. I think the odds that bulls break above the wedge and start a new bull rally are very low and much more likely is a trap over the next 1-5 days and then a reversal down to at least 2540. That’s all I have to write about this right now.
comment: I always think about wrong outlooks much more than about right ones. In this case, was the “no interest in buying this high“ the right call here and I would come to a yes in every scenario. Of course it was wrong and market made another 50 points but risk reward was so off, not taking it was the right move for me. Anyhow. Bulls confirmed another bullish structure and we have a bull wedge inside a very bullish channel upwards.
current market cycle: Bull trend
key levels: 2570 - 2700
bull case : Bulls had the fastest and most shallow two legged pullback there is on Tuesday/Wednesday and continued with max bullishness for 2650. By now every bear has given up and we will truly find out how high this can go over the next months. As of now my preferred pattern is the bull channel and since we are at the highs, bulls would need another strong bar like Friday to break above it. Can they get it? Absolutely. Am I betting on it? No.
Invalidation is below 2570.
bear case: No idea where and how strong they come around. Will most likely be more bulls taking profits rather than strong selling. Lower bull trend line is 50 points lower and I doubt we hit it on Monday. Buying 2640 is a bad trade and bears know it but I rather wait and see where we go. On the 1h tf we have not traded below it since Thursday’s Globex session. Currently very hard for bears to make money so make your life easier and look for longs.
Invalidation is above 2660.
outlook last week:
short term: Neutral. I need to see bear strength before selling this. No interest in longs above 2600.
→ Last Sunday we traded 2610 and now we are at 2646. Meh outlook because bulls were much stronger and broke above again but I also advised against shorts until bears come around. They did not.
short term: Neutral. I won’t be buying 2646. Need a pullback.
medium-long term: Very strong breakout above, again. Market currently has no ceiling. Most likely 2700 next and I do think 3000 could be a potential target if we continue. There is certainly an argument for a measured move based on the bull rally from 2018-08 to 2020-08.
current swing trade: None.
chart update: Added bull wedge.

GOLD MCX:GOLD1! Weekly bullish chart setups with parabolic formation in India MCX market, whereas Gold comex trading at new lifetime high. Macd shows positive momentum with like a fast and furious moves possible in near future.

Gold long termStill going in the right direction. Resistance at 3200 to 3400 area give or take 50. Then next big move up to final target #1 is around 6k and if we over shoot in the madness then 9 to 10k.

Gold vs Oil RatioGold vs Oil Ratio. Along with the simple Gold graph to highlight what drives this ratio change.

This is Wyckoff VSA Buying at a Supply Line with SMIIn this short video, Author of "Trading in the Shadow of the Smart Money", Gavin Holmes, explains a very important set up to go long. It is called buying into a supply line and is clearly shown in this video.

COT Strategy - Gold ShortDISCLAIMER: This is not trade advice. This is for educational purposes only to demonstrate how I am looking to participate in this market. There is significant risk involved in trading, do your own homework and due diligence.
COT Strategy
SHORT
Gold (GC)
My COT strategy has me on alert for short trades in GC if we get a confirmed bearish change of trend on the Daily timeframe.
COT Commercial Index: Sell Signal
Valuation: Overvalued vs Treasuries
Extreme Positioning: Commercials most short they have been in last 3 years = bearish. Only thing that would be better is SS's making an extreme in long positioning, but no luck with that yet (but something I'm watching).
OI Analysis: OI has been increasing on up move since June. When OI increases, we need to ask "who caused the OI increase"? When it is caused by Large Specs & Small Specs, it is bearish. In the case of Gold, it is being caused by LS & SS's, which is bearish.
Spread: Bearishly diverging.
ADX: Diverging, implying the trend lacks integrity.
Supplementary Indicators: Acc/Dis , %R, Stochastic & Momentum (not yet triggered)
Remember, this is not a "Short Now" idea. These indicators are not timing tools. They simply tell us that this market could have a move of some significance to the downside, which we will participate in with a confirmed Daily trend change to the downside.
Good luck & good trading.

GC! TO THE MOON
Price Trend
Gold futures (GC1!) are currently showing a strong upward trend. The chart indicates that the price has formed a clear upward channel since the end of 2022, and has recently broken through the upper boundary of this channel, demonstrating even stronger upward momentum.
Key Data
Current price: $2,646.2 per ounce
Change: +35.5 (+1.36%)
Trading volume: 893,122 contracts
Technical Analysis
Trend: The long-term trend is clearly upward, with short-term acceleration in price increases.
Support and Resistance:
Major support is at the lower boundary of the ascending channel, around $2,400.
The current price has broken through previous highs, with no obvious resistance at the moment.
Volume: Recent trading volume has remained at relatively high levels, supporting the price increase.
Seasonality: According to the seasonal data at the bottom of the chart, September is typically a weaker month for gold performance, but this year has shown exceptionally strong performance.
Market Sentiment
There is currently strong demand for gold in the market, possibly influenced by global economic uncertainties and inflation concerns.
Risk Warning
Although the current trend is strong, the price is at historical highs, posing a risk of correction. Investors should closely monitor changes in the global economic and geopolitical situation.
Summary
Gold futures are currently in a strong uptrend, with the breakthrough of key resistance levels indicating strong bullish sentiment in the market. However, considering that prices are at high levels, investors should remain cautious when making trading decisions and set appropriate stop-losses.

Sell Russell and Gold tomorrowTomorrow I will be looking for shorts if everything went like expected. Setups are explained in detail in the video #trading #goldtrading


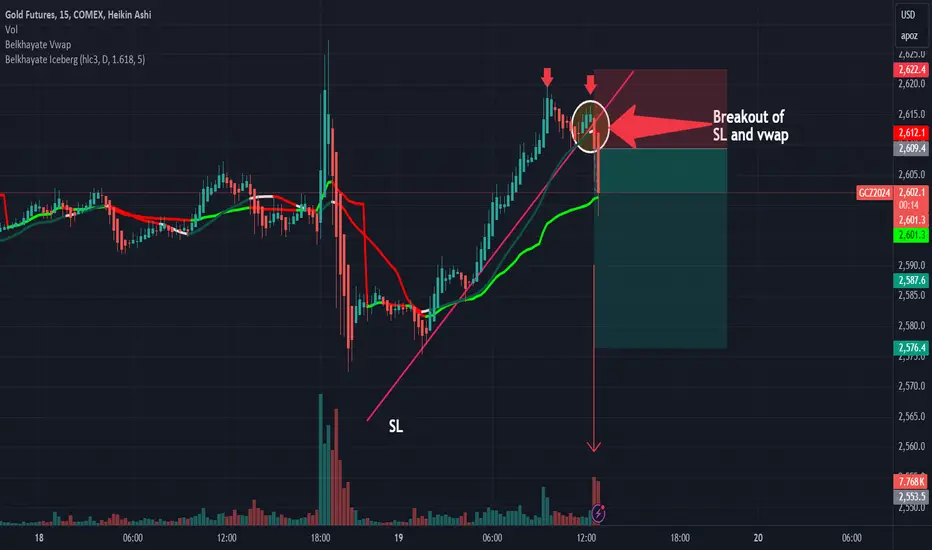
GC1: Sell ideaSell idea on GC1 as you can see on the chart because we have the breakout with force the support line and the vwap indicator....
2024-09-18 - priceactiontds - daily update - goldGood Evening and I hope you are well.
tl;dr
Gold - Bull trap above the bull wedge as I wrote. Bears confirmed it with the close today. I look for shorts tomorrow and expect 2560 or lower to be hit tomorrow. Anything below 2540 would be a huge surprise and we could see an acceleration down to 2500. If bulls reverse this and trade back above 2610, bears will most likely give up until we hit 2700.
comment: Another spike and new ath but huge rejection. I do think the rejection was strong enough to expect follow through and test the lower bull wedge trend line around 2550/2560.
current market cycle: bull trend
key levels: 2550 - 2630
bull case: Bulls tried to break above the bull wedge and failed. Odds now favor a retest of the lower trend line (daily ema is also there), where I expect buyers to step in more strongly again. If bears somehow fumble this again, bulls would need a reversal of the huge 1h bar and get back above 2600. The longer bulls can stay around 2600, the better.
Invalidation is below 2540.
bear case: Bears want to keep the momentum strong tomorrow (after the 50+ point rejection from the new ath) and test down to 2550. If they somehow manage to break below 2540, we could see an acceleration down to 2500/2520 but I highly doubt that. Since we had a spike up and then a huge spike down, the dominant pattern is still the bull wedge and there is not much more magic to it than what I described. Bears absolutely need to keep it below 2600 to have a chance of lower prices.
Invalidation is above 2605.
short term: Neutral until bears get follow through below 2570 or 2600 is clear resistance now.
medium-long term: 7 consecutive months where Gold barely went below previous month’s low. Strong buying on the monthly chart but also the third push up we are currently in. I highly doubt bulls get another one so if it continues, it’s without me. I am waiting for a bigger correction.
current swing trade: None
trade of the day: How could you predict those spikes today? You can’t. How can you trade them? Only viable could have been shorting the spike above 2620 but those are hard to take. You would need a wide stop and scale in. One time you short it correctly and make the trade of the week and next time you blow your account if you are not humble enough. Today was no obvious good trade to be honest.

Gold to 2530From what we saw during the FOMC meeting I predict to see the price of Gold more lower than the Monthly opening;

GC Short 09/18/24Selling inside of the previous day premium area. Looking to take out 11am sell side liquidity. Price already showing signs of weakness and looking to trap impatient sellers.

SPY/QQQ Plan Your Trade Update For 9-17 : Wednesday is CriticalIf you were paying attention to my SPY Cycle Patterns today - boy, a beautiful "top" pattern setup today. Just like my SPY Cycle Patterns predicted more than 3 years ago.
If you've been following my research, you already know I've identified dual excess Phase Peak patterns that should resolve into a rollover topping pattern, sending the SPY/QQQ moving downward towards the end of this week (Sept 19-20). If the current Ultimate High price level continues to act as resistance, there is a real potential for the SPY/QQQ to move into a downward momentum breakdown the following week (Sept 23-30).
But, the one thing that throws the whole topping pattern into a mess is that the RSP has already broken to new ATHs and appears to be attempting to hold above the previous high-price fractals. Thus, we are seeing the equal-weighted S&P already moving into a broad value-based rally phase.
Watch this video to understand why I continue to suggest traders avoid engaging in any big trades or get greedy, thinking they are going to WIN BIG on their trades. Yes, I'm sure some people will hit their targets over the next 3-7+ days, but others will get run over (hard).
Unless you really like taking the risk of getting run over by the markets or market makers, I suggest sitting back and reading a good book while the markets or traders struggle to find their exits.
One thing is certain: the markets will move into a trend by the end of September—either into a breakaway rally phase or into a rollover topping phase.
You'll have lots of time to position for these trends because my research shows the next cycle phase is October 7-10 (nearly two+ weeks away).
So, why stress out about tomorrow's Fed Rate decision? Just sit back and wait for the markets to give you a clearer understanding of what's next.
I'll create another morning video tomorrow morning.
Get some.
#trading #research #investing #tradingalgos #tradingsignals #cycles #fibonacci #elliotwave #modelingsystems #stocks #bitcoin #btcusd #cryptos #spy #es #nq #gold

GOLD FUTURES MCX ANALYSIS ( LOOKING BULLISH )Gold futures looks bullish and we can expect levels upto 82300 once it crosses 76100 in near term ( By 30th November ).levels are marked in chart posted. Before we witness breakout of 76100 view is cautious and one should remain bullish with buy on dips strategy .
