#NATURALGAS 1st August ViewCAPITALCOM:NATURALGAS Currently looks doing a five swing structure from Feb low and any sell off should remain supported at this levels for atleast one more push higher.
Natural Gas Mini Futures
Sorry, this is only available to registered users
MCX provides data to our registered users only, so to get it you'll need to sign up for a TradingView account.
Contract highlights
Related commodities

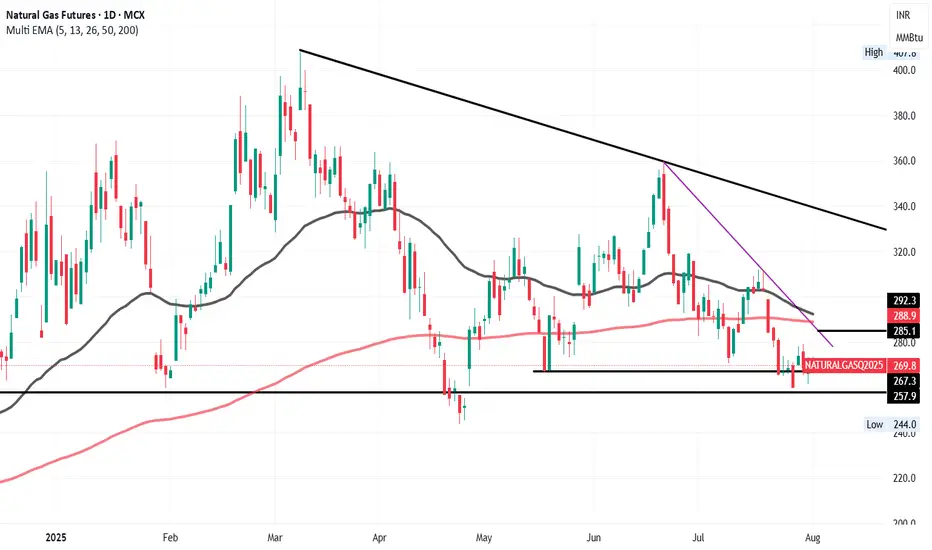
Natural Gas – Bullish Rebound Expected Towards 285–288Natural Gas is currently showing signs of a short-term bounce after testing key support around the 267–258 zone. My view remains bullish in the short term with potential upside toward 285–288, which aligns with the downward purple trendline and both the 50 EMA (around 292.3) and 200 EMA (around 288.
U.S. Natural Gas Poised for Rebound After Steep July DropU.S. natural gas prices sank in July due to mild weather, strong supply, and LNG export disruptions. The EIA cut its price outlook but expects a recovery by winter.
While technicals hint at a short-term rebound, oversupply and weak summer demand keep pressure on prices. A sustained recovery depends

NatGas short term long opportunity Natgas MCX future may go upside target of 300+ from Cmp - 265 , SL - 259. If Buyer Accumulate and sustain level of 265 . Time horizon - 4-6 weeks

Gold | Oil | Dollar | Silver | Natural Gas Price ForecastGold | Oil | Dollar | Silver | Natural Gas Price Forecast
COMEX:GC1! COMEX:SI1! AMEX:UNG PEPPERSTONE:NATGAS

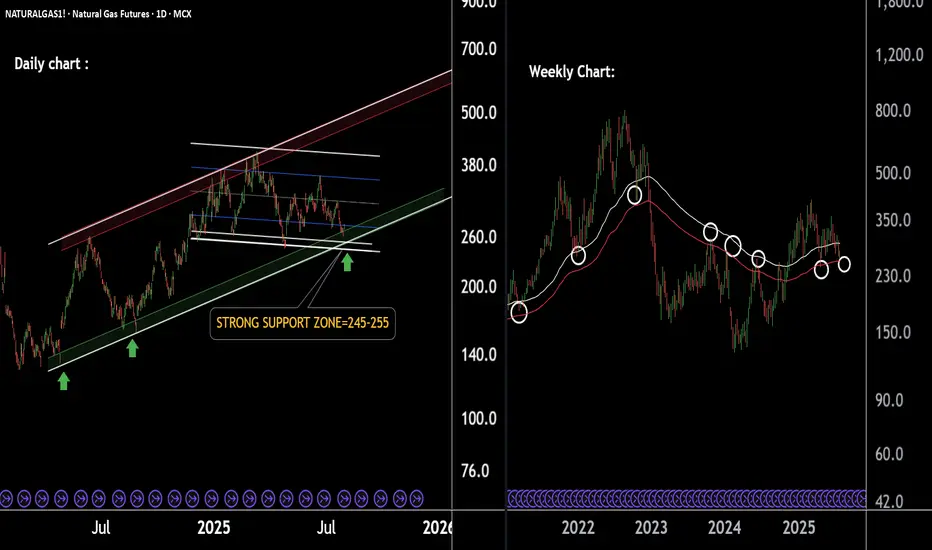
Natural Gas Cooling Near Support Zone – Bounce Ahead!Natural Gas Technical Overview (2-Chart Analysis):
Chart 1 – Parallel Channel Formation:
Natural Gas is moving within a well-defined parallel channel.
The lower support boundary of this channel is observed near 250, indicating a potential bounce zone.
Chart 2 – EMA-Based Support Structure:
Pric
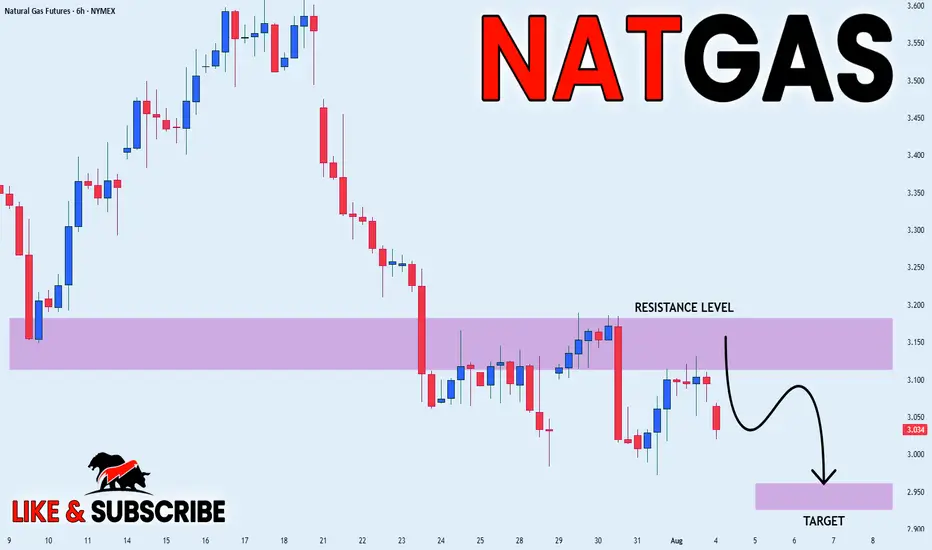
NATGAS WILL FALL|SHORT|
✅NATGAS has retested a key resistance level of
And as the pair is already making a bearish pullback
A move down to retest the demand level below at 1.3434 is likely
SHORT🔥
✅Like and subscribe to never miss a new idea!✅
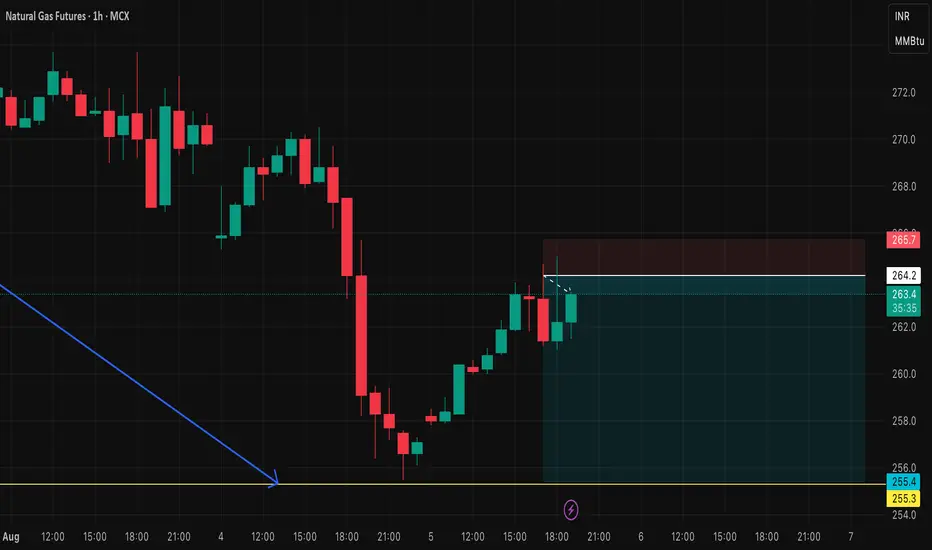
NF FUT short setupNG FUT short setup
Entry price - 264.2
Stop loss - 265.7
Target - 255.5
Risk Reward - 1:5.6
NATGAS Risky Long! Buy!
Hello,Traders!
NATGAS keeps falling down
In a strong downtrend
And Gas is locally oversold
So after the price hits the
Horizontal support of 2.860$
We will be expecting a
Local bullish correction
Buy!
Comment and subscribe to help us grow!
Check out other forecasts below too!
Disclosur

3$ psychological level natural gas bounceGood long opportunity for natural gas at the 3$ level.
Argument1: Weekly candle held the 3 $ psychological level
Argument2: Gap fill on Ng1! natural gas futures
Argument3: Triple bottom on XNGUSD natural gas

See all ideas
Summarizing what the indicators are suggesting.
Neutral
SellBuy
Strong sellStrong buy
Strong sellSellNeutralBuyStrong buy
Neutral
SellBuy
Strong sellStrong buy
Strong sellSellNeutralBuyStrong buy
Neutral
SellBuy
Strong sellStrong buy
Strong sellSellNeutralBuyStrong buy
A representation of what an asset is worth today and what the market thinks it will be worth in the future.
Sorry, this is only available to registered users
MCX provides data to our registered users only, so to get it you'll need to sign up for a TradingView account.
Frequently Asked Questions
The nearest expiration date for Natural Gas Mini Futures is Aug 26, 2025.
Traders prefer to sell futures contracts when they've already made money on the investment, but still have plenty of time left before the expiration date. Thus, many consider it a good option to sell Natural Gas Mini Futures before Aug 26, 2025.
Open interest is the number of contracts held by traders in active positions — they're not closed or expired. For Natural Gas Mini Futures this number is 38.07 K. You can use it to track a prevailing market trend and adjust your own strategy: declining open interest for Natural Gas Mini Futures shows that traders are closing their positions, which means a weakening trend.
Buying or selling futures contracts depends on many factors: season, underlying commodity, your own trading strategy. So mostly it's up to you, but if you look for some certain calculations to take into account, you can study technical analysis for Natural Gas Mini Futures. Today its technical rating is sell, but remember that market conditions change all the time, so it's always crucial to do your own research. See more of Natural Gas Mini Futures technicals for a more comprehensive analysis.