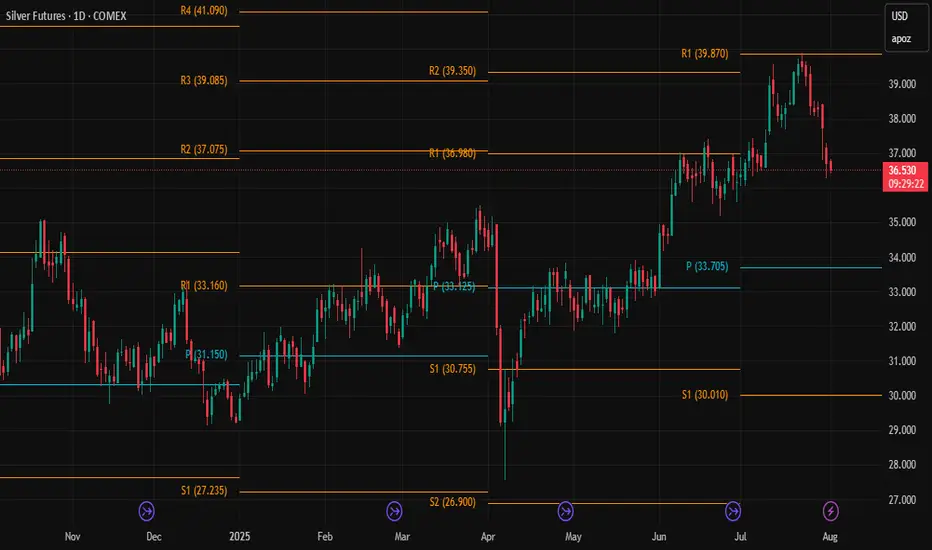
It would be nice to see Silver drop towards the Pivot for a buy.There is no prediction, just looking at the pivots. It would be nice to see silver drop down under 35.00 into the quarterly pivot point to add to positions.
Silver Mini Futures
SILVERMJ2026 trade ideas
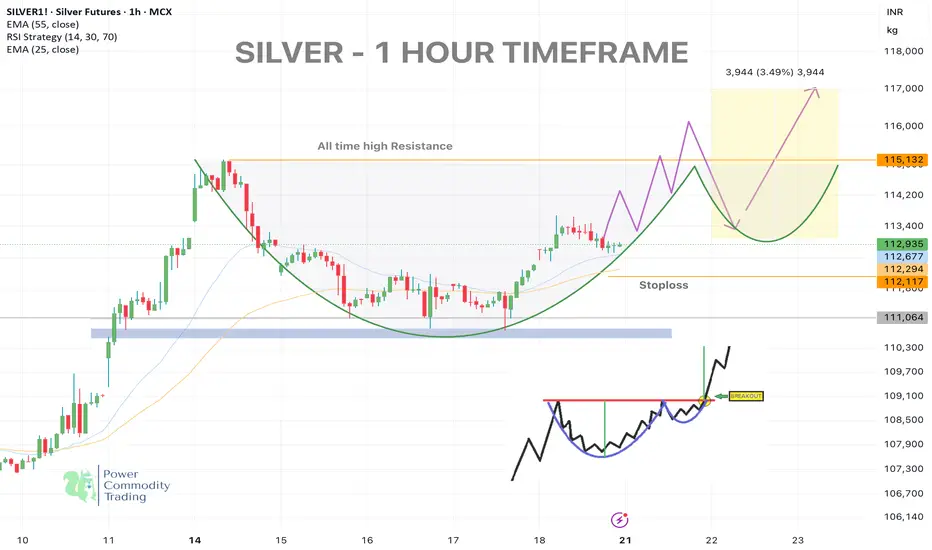
SILVER WEEKLY UPDATE - Dead Cat Bounce Setup📉 SILVER – 1H TIMEFRAME - Inverted cup and handle pattern
Silver tested support around 112,800–113,000 after a rounded top formation, rejecting the key EMA zones (25 & 55) and the previous demand-turned-supply zone.
🟠 Scenario Unfolding:
Expecting a short-term bounce towards 113,750–114,200 (EMA cluster zone) — this could act as a dead cat bounce, offering an opportunity to re-enter shorts.
Confluence Factors:
• Rounded top structure
• EMA resistance
• Weak macro data (Durable Goods Orders down -9.3%)
• Risk-off sentiment supportive of range contraction
🔻 Primary Bias: Bearish Continuation
After the bounce:
• Short Entry Zone: 113,800–114,200
• Target: 111,250
• Risk:Reward ≈ 1:2
⚠️ Invalidation: Sustained close above 114,700 .
📌 Note: Watch price action closely near 114,000 – this is the decision point for the next leg.
#CrudeOil #naturalgas #MCXCrude #PowerOfCommodity #TriangleBreakout #TradingViewIndia #EnergyMarkets #TechnicalAnalysis
Comment below if you think it Will retest then fall?

Silver Near $40: Deficits and Demand Fuel the RallySilver prices surged to multi-year highs in July 2025, driven by an extraordinary convergence of bullish factors, pushing prices above $39 per ounce, levels last seen in 2011.
Silver’s rally, supported by robust industrial demand and safe-haven inflows, aligns with traditional patterns as the U.S. dollar has weakened over 2.3% over the recent period.
Macroeconomic Drivers and the U.S. Dollar
Silver's rally is unfolding around shifting macro conditions. The Federal Reserve has kept interest rates at a restrictive 4.25-4.50% throughout 2025 due to persistently high inflation (2.7% YoY). However, expectations for more rate cuts are growing, with the CME FedWatch tool showing a 59.8% probability of a cut at the September meeting as of July 28.
Adding to the complexity, U.S. trade policies have triggered significant market volatility and raised concerns over a potential supply shock. The U.S. administration has imposed steep 30% tariffs on imports from Mexico, set to resume on August 1. This has heightened fears, as Mexico is the world’s largest silver producer and supplies over half of U.S. silver imports.
But macro drivers aren’t the full story. The real force behind silver’s rally lies in the physical market itself. A structural supply deficit, escalating industrial demand, and growing investor appetite from Asia and North America, are proving to be far more pivotal than shifting rates or a softer dollar.
Physical Market Dislocation and Industrial Demand
The year 2025 marks the fifth consecutive year of a structural deficit in the global silver market, and the imbalance between supply and demand shows no sign of easing.
With minimal new mining capacity expected to come online and lengthy lead times for project development, supply constraints are structural rather than temporary.
Since 2021, the cumulative shortfall has reached nearly 800 million ounces (25,000 tons), steadily drawing down available inventories and tightening the market.
Industrial demand remains the central pillar of silver’s bull market. Forecasts for 2025 project record consumption of roughly 700 million ounces, driven by rapid adoption in green technologies and digital infrastructure. The electrical and electronics sector, which includes solar photovoltaics (PV), consumer electronics, automotive electronics, power grids, and 5G networks, has increased its silver usage by 51% since 2016.
Solar PV alone consumed approximately 197.6 million ounces in 2024, a record largely driven by China’s 45% expansion in solar capacity. With global EV production expected to approach 20 million units in 2025, automotive silver demand alone could exceed 90 million ounces.
Together, persistent deficits, accelerating industrial consumption, and capital flowing into physically backed investment vehicles are creating a market where available silver is increasingly scarce, amplifying upside pressure on prices regardless of short-term macroeconomic shifts.
COMEX silver inventories peaked at 504.72 million ounces on May 11 but have since eased back to levels last seen on April 24, indicating a recovery in demand following the large accumulation in US inventories post-tariff shock.
Positioning and Ratios Favour Gains
With net inflows of 95 million ounces in the first half of 2025, silver ETP investment has already surpassed the total for all of last year. By June 30, global silver ETP holdings reached 1.13 billion ounces, just 7% below their highest level since the peak of 1.21 billion ounces in February 2021
Futures positioning has also surged , with long positions up 163% over six months. These factors have helped propel silver prices over 35% higher year-to-date, building on a 21% gain in 2024.
The iShares SLV ETF netted inflows of $1,467.5 million over the past 3 months.
Physical silver investment demand remains robust, with significant buying from Asian markets. India, the world’s leading silver importer, saw record purchases of physical bullion and silver-backed ETFs during the first six months of 2025.
The gold-to-silver ratio, currently in the late 80s, remains historically elevated, suggesting silver remains significantly undervalued compared to gold. This indicates substantial upside potential for silver, especially given persistent market deficits, rising industrial and investment demand, and gold rising at the same time.
Hypothetical Trade Set-up
The silver market’s bullish fundamentals appear increasingly robust. Investors may consider accumulating silver positions, viewing short-term consolidations as attractive buying opportunities amid the compelling long-term outlook.
Options open interest for the September contract shows a bullish bias with a put/call ratio of 0.82 and high call interest at the far out-of-the-money call strike of $45 per ounce.
To express a bullish view on silver, investors can deploy a long position in CME Silver futures expiring in September. A hypothetical trade setup for this view is described below.
● Entry: $38.00 per ounce
● Target 1: $40.00 per ounce
● Target 2 (extension): $42.00 per ounce (if Fed easing in September coincides with physical tightness)
● Stop Loss: $36.70 per ounce
● Profit at Target 1: $10,000
● Profit at Target 2: $20,000
● Loss at Stop: $6,500
● Reward-to-risk ratio: 1.54 (Target 1) and 3.08 (Target 2)
Alternatively, investors can exercise the same view using CME Micro Silver futures, which offer smaller notional positions and more flexibility. Each Micro contract is priced in USD per ounce and represents 1,000 ounces of silver, compared to 5,000 ounces for the standard contract.
MARKET DATA
CME Real-time Market Data helps identify trading set-ups and express market views better. If you have futures in your trading portfolio, you can check out on CME Group data plans available that suit your trading needs tradingview.com/cme .
DISCLAIMER
This case study is for educational purposes only and does not constitute investment recommendations or advice. Nor are they used to promote any specific products, or services.
Trading or investment ideas cited here are for illustration only, as an integral part of a case study to demonstrate the fundamental concepts in risk management or trading under the market scenarios being discussed. Please read the FULL DISCLAIMER the link to which is provided in our profile description.
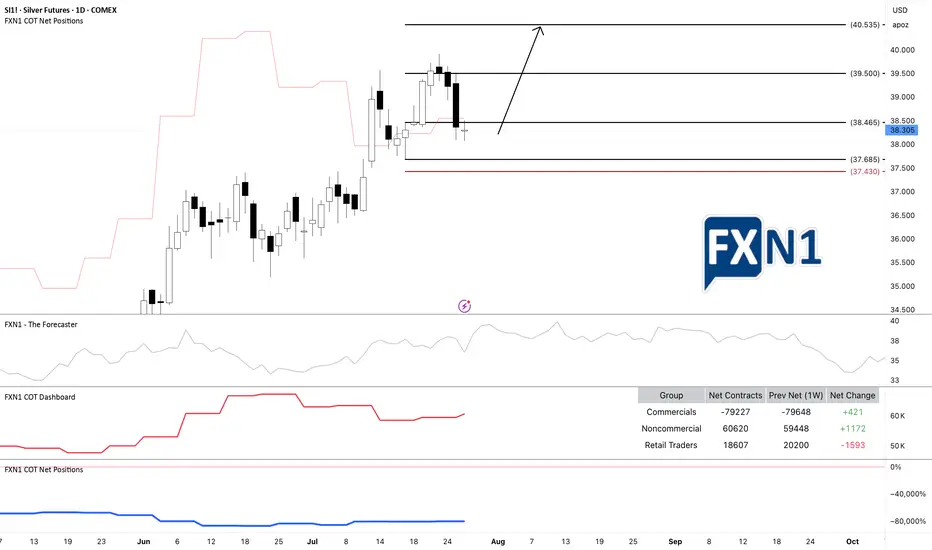
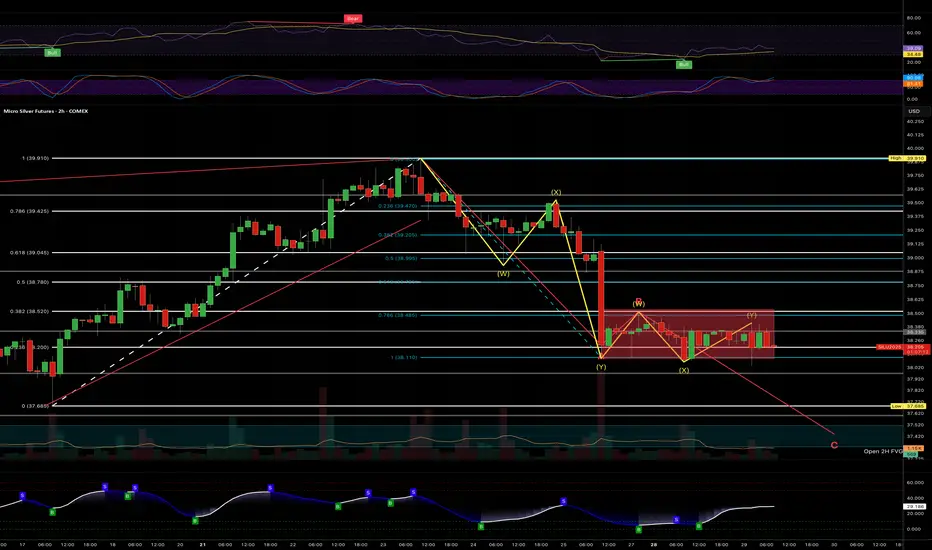
SI1!: Silver Demand Zone: Possible Bullish ContinuationI am currently observing a potential long-term continuation on SI1! Silver (XAG/USD), as the Commitment of Traders (COT) data indicates an increase in positions from both commercial and non-commercial traders. The price is approaching a demand zone on the daily chart, suggesting a possible bullish move.
The recent price action originated from an initial spike in the monthly supply zone, but there’s a possibility that the price could continue to rise further before reaching the next supply zone where a reversal might occur. Given the daily timeframe, I view this setup as suitable for a scalp trade. In my opinion, this presents an opportunity for short-term traders to capitalize on the potential upward movement.
✅ Please share your thoughts about SI1! in the comments section below and HIT LIKE if you appreciate my analysis. Don't forget to FOLLOW ME; you will help us a lot with this small contribution.
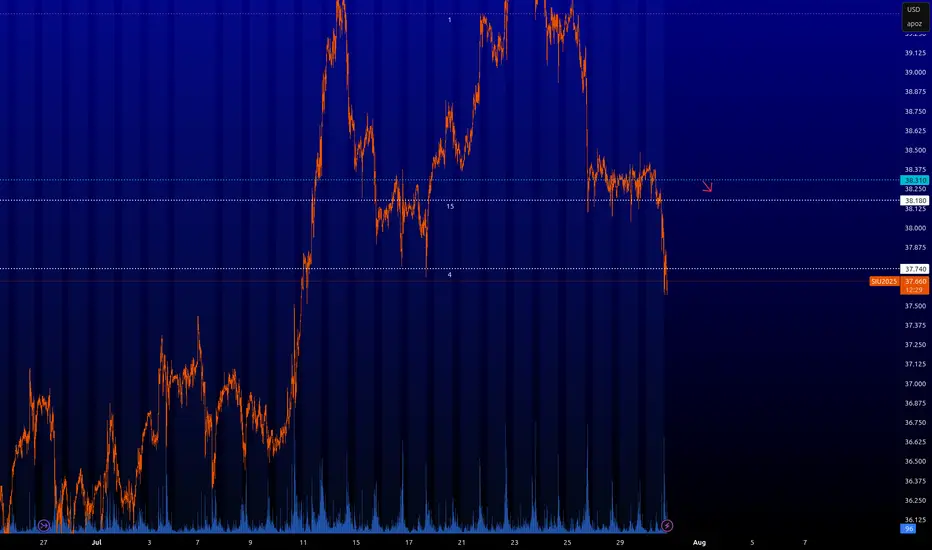
SI : Key levelsIt is possible to take a short from the blue level with an arrow. The other levels are still inactive. When it will be possible to take trades from them I will inform you. In the meantime, you can use them as part of your trading system.
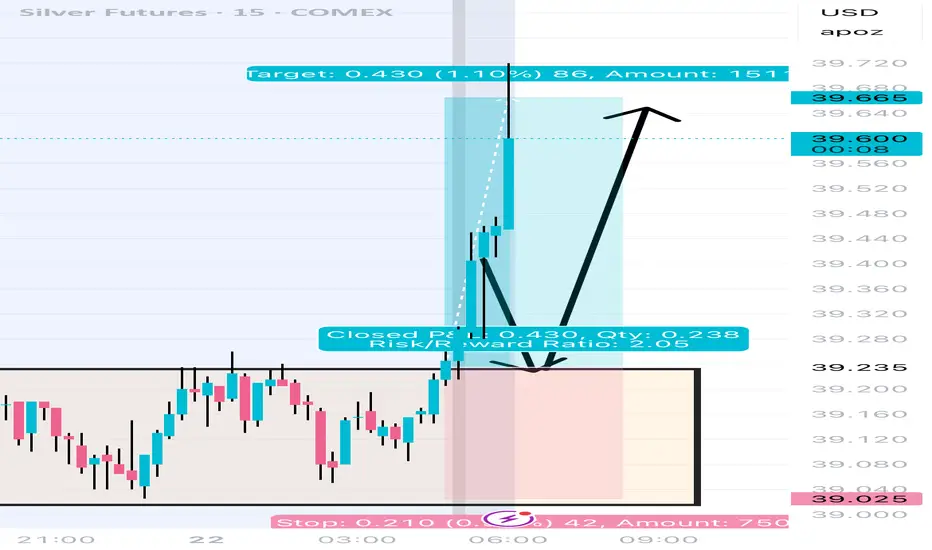
7/22/2025 SI Futures Bullish
weekly: 🐂
daily: 🐂
risk: 1:2
strategy: supply and demand
86 ticks on SI, no drawdown! 📈
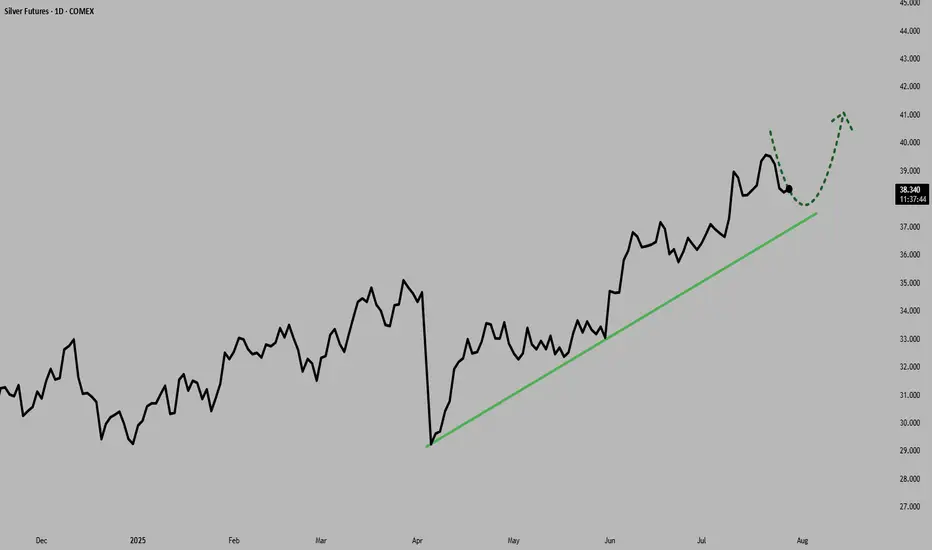
Journey of silver buy at support sell at resistance There is Up trending channel, follow the channel and make money since silver is long term bullish atleast.
Not mentioning the levels do the math follow the channel and find the support

#SILVER #MCX Short term buying oppturnuity#SILVER #MCX Short term buying oppturnuity seen. Condition for buying and levels to look for has been shared for reference.

Silver market's ambiguityFollowing up my last idea - you can see short term time frame (15m) shows alot of ambiguity in the direction it wants to go... Again, just watching for now - but a breakdown could mean low $37s briefly, imo.

Silver - failure to break highs yesterday...This week is news packed... I was hoping to see Silver break above recently lower highs.
I am out of all positions - but I would not be surprised to see further breakdown in a second corrective leg, finding support at the FVG above next fib retracement.
Like I said, though, this week has alot of material news - so its all games... Will have to watch price action to make a determination of which direction I'll play.
I am very bullish on Silver over next 12 months - but next 12 days??? We'll see.
SILVER Fut Broken out after a decadeBroke out of a 10 plus range..target metioned on the chart....which is 50% profit in a few years time....This is no nuclear science...its simple. Anything which is in a range for more than a decade will shoot once it clears that range..its simple...So buy...

Silver RSI DivergenceLast night, I set a couple of orders on Silver to see if I can get an entry. Got stopped out on a few contracts, but long ~10 between my accounts.
I am long ES and Silver due to this weeks macro and expected volatility.
Nice RSI divergence, so expecting a nice play here as the week unfolds and with recent drops into oversold territory.

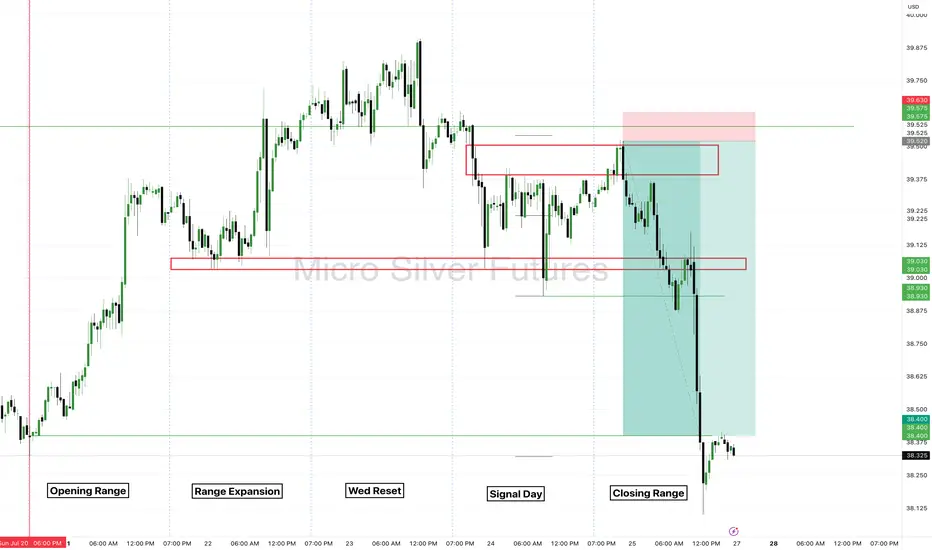
Silver Futures - Closing Range of the Week.Real trading comes down to the patience combined with emotional control to have the highest possible edge.
COMEX_MINI:SIL1!
There is no reason for your chart to filled be filled with ineffective distraction. Instead focus on simplicity to know exactly what to take a trade on. Be a hunter looking for the easy prey!
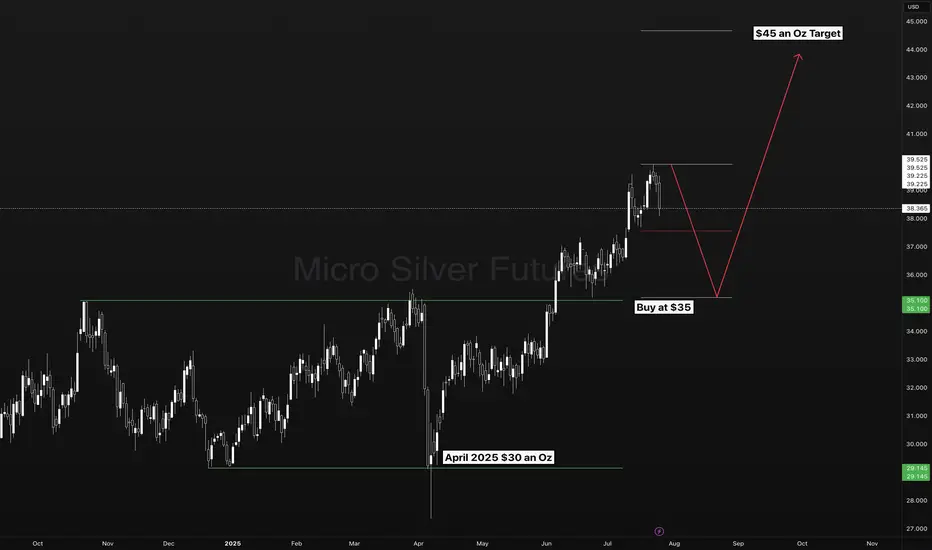
Silver - The Long Term SetupSilver on the longer term may be setting up for a trend continuation opportunity from $35 to $45 dollars an Oz.
Do you Trade FOREXCOM:XAGUSD ?
Do you Trade FOREXCOM:XAUUSD ?
Short term buying opportunity Silver Futures ComexRecent weakness in silver futures could be an buying opportunity on 3 hour candel chart.
Wait for both indicators below to reach oversold levels like it is showing now. Long term 1 day chart showing long term bull trend with much higher upside. I expect silver prices to remain in uptrend. All time highs could be reached in 6 to 1 year period from now.

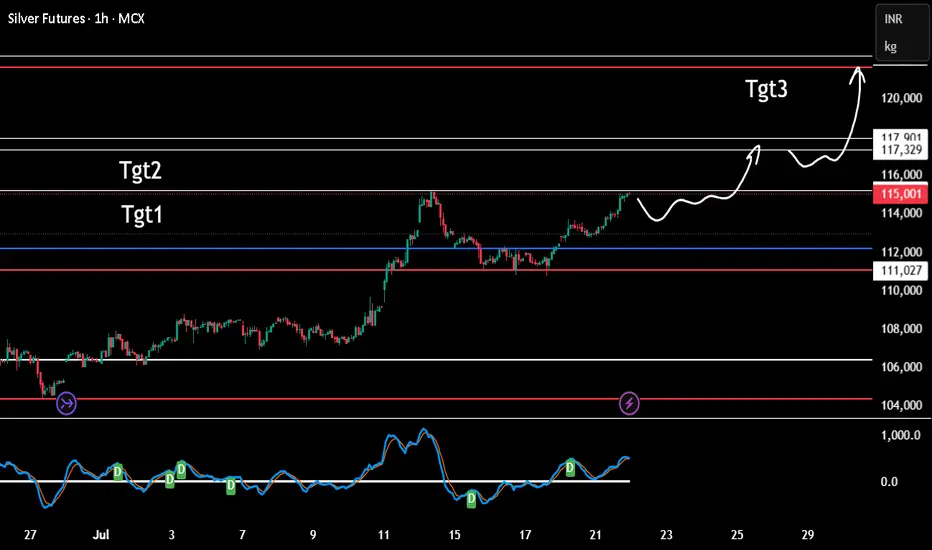
Silver expectationTgt 1 reached. A break out will take to tgt 2 and then tgt 3
Tgt1 is being tested second time, for good break out we need third re-test hence expecting some retracement before a a real break out. Anything above is a possible trap unless the momentum is fast and swift.
CUP & HANDLE + ROUNDED BOTTOM IN SILVERSilver (MCX: SILVER1!) – 1 Hour Chart Analysis
🔍 Pattern Formation: Cup and Handle + Rounded Bottom
Silver has formed a classic Cup and Handle pattern on the 1H timeframe, indicating a potential bullish breakout above the neckline near 115132 (all-time high resistance).
A smooth rounded bottom confirms strength in accumulation.
📈Bullish Signals Observed:
Price holding above 25 & 55 EMA
Strong volume near the neckline
Rounded base indicates strength from bulls
Potential breakout zone highlighted
🎯 Upside Targets (upon breakout):
Target 1: 113820
Target 2: 114600
Target 3: 115132 (Neckline / Breakout Level)
Target 4: 116750
Target 5: 118850 (Fib Extension 161.8%)
Stoploss: 112117 (below handle low & EMA crossover zone)
🪙 Risk Management:
Trade only on breakout confirmation with volume. Maintain defined SL as price is near a historic resistance.
📌 Disclaimer:
This is a technical analysis based on historical chart behavior and is not financial advice. Please conduct your own due diligence. Trading involves risk.
❤️ If you found this helpful, don’t forget to like the post!
Silver to $38The move from March 2020 to August 2020
Was a measured move that played out to the Tee.
We have a similar structure building that projects to the High 30's
Suggesting #Gold move beyond ATH's and #Silver the beta play to move faster in an attempt to catch up, and move towards it's high's again.

Silver Futures Rally: Riding the Upper Bollinger Band
Price is riding the upper band, a classic signal of strong bullish trend continuation.
Strong support near $34.50–$35.00 (prior consolidation zone and Bollinger midline).
Psychological support at $36.00 which was broken and now may act as support-turned-resistance.

Silver futures could be hitting a high resistance zone.Resistance along this upper channel was significant on 3 prior occasions over the last couple of years. We're here now for the 4th time. Could be a high resistance zone. I expect a retrace at the least.
Fibs are pointing higher however unlikely that seems.
If we bust through, WOAH NELLIE!

Silver: Daily Reversal Possible at Supply ZoneI'm anticipating a potential daily reversal in silver prices. Retail traders are maintaining a bullish stance, while commercial traders remain heavily short. The current price action suggests a possible reaction to a key supply area. What are your thoughts on the likelihood of a reversal, and what technical indicators might support or refute this potential shift?
✅ Please share your thoughts about SI1! in the comments section below and HIT LIKE if you appreciate my analysis. Don't forget to FOLLOW ME; you will help us a lot with this small contribution.

BTC, ETH, GC & SI Daily Trade SetupsIn this update we review the recent price action in Bitcoin, Ether, Gold & Silver futures contracts and identify the next high-probability trading opportunities and price objectives to target. To review today's video analysis, click here!

Silver's Key Support Holds: Bullish Target at $39.20 Near TermCurrent Price: $37.12
Direction: LONG
Targets:
- T1 = $38.50
- T2 = $39.20
Stop Levels:
- S1 = $36.60
- S2 = $36.20
**Wisdom of Professional Traders:**
This analysis synthesizes insights from thousands of professional traders and market experts, leveraging collective intelligence to identify high-probability trade setups. The wisdom of crowds principle suggests that aggregated market perspectives from experienced professionals often outperform individual forecasts, reducing cognitive biases and highlighting consensus opportunities in Silver.
**Key Insights:**
Silver has shown resilience at its current levels, supported by increased industrial demand and heightened investor interest due to inflationary concerns. The metal remains strongly positioned as a hedge against macroeconomic uncertainties, including currency devaluations and geopolitical tensions. Technical indicators show a consolidation phase near the $37 range, presenting an upside potential if momentum persists. Key support levels around $36.60 strengthen the case for bullish sentiment, while upside resistance near $38.50 may be tested soon.
**Recent Performance:**
Over the last few weeks, Silver has experienced steady growth with a notable 5% climb from the $35 price zone. Despite minor retracements triggered by short-term profit-taking, strong underlying demand has consistently pushed prices back above critical levels. This performance highlights growing optimism for commodities in general, as traders eye Silver's historic role as a safe-haven asset during times of economic uncertainty.
**Expert Analysis:**
Market experts point to bullish patterns forming on Silver's daily charts, with its relative strength index (RSI) hinting at further upward movement. The convergence of moving averages signifies medium-term bullish strength, bolstered by increasing net longs in futures contracts. Experts also cite expanding industrial applications of Silver, especially in renewable energy technologies and electric vehicles, enhancing its demand profile in the long run.
**News Impact:**
Recent inflation-linked announcements have bolstered Silver's appeal as an investment hedge, while budget allocations in renewable energy initiatives signal supply-chain expansions for Silver usage. Additionally, the Federal Reserve's cautious stance on rate hikes has maintained supportive conditions for precious metals, which thrive in lower interest rate environments. These factors contribute positively to Silver's price outlook.
**Trading Recommendation:**
Traders seeking exposure to safe-haven assets or hedges against economic uncertainty may consider taking a long position on Silver. With critical support levels holding firm and a favorable demand backdrop, the metal offers a robust upside potential toward the $39.20 resistance in the near term. Placing stops below $36.20 can help mitigate downside risks, allowing traders to capitalize on this promising setup.
