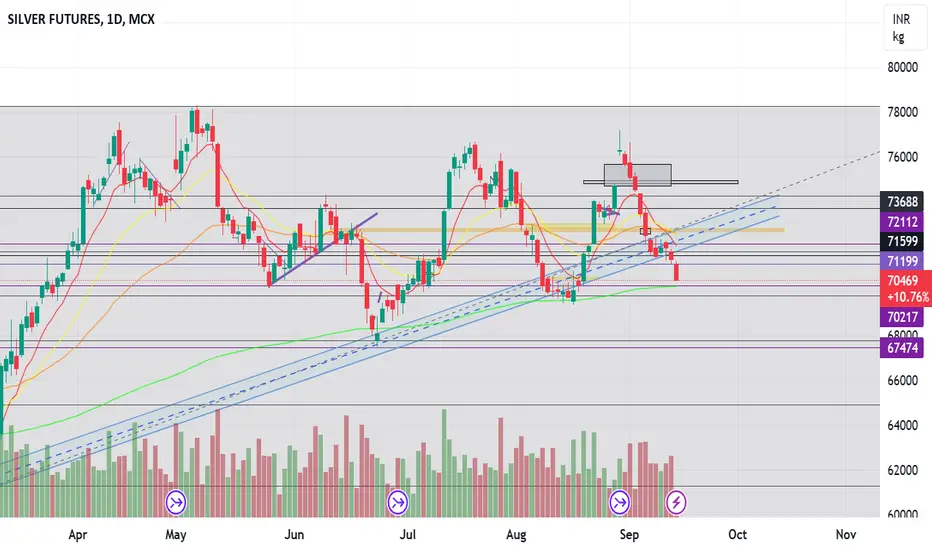
Silver ready for upside move On Our Harmonic pattern indicator based trade setup take trade as explained below :-
Early trades Buy or sell below/ above 23.6 %, safe trades buy or sell above / below 41% , after taking trade next upside or downside levels will be target ,
When reverse buy or sell signal appear then book profit on Target or trail SL to 23.6 % If trailing SL hit then early trade can be taken above or below 23.6 and safe trade can b taken above/ below 41% ..
Please note:-
It's working on news based and volitile market very well so exit if SL hit
Silver Mini Futures
SILVERM1! trade ideas

Sell silverNote the levels #silver
Sell silver at the level
According to my analysis silver to be sell as per my chatings

SILVER Silver clearly showing downtrend further support may be looked at 69700 @ 200EMA:<If it contiounsly fall down , we could expect retreat at 67700 @ 0.61 FIB.
BEST BUYING LEVELS FOR SILVER IS 64000 TO 65000. TARGET - 79000 TO 82000
Monthly Silver chart might bounce off of trend lineSilver has sold off aggressively the last few days. You can see that the price is now right near an ascending trend line. If this trend line holds, then we can expect a bouce upward soon.
The trend line is not quite touched. Maybe price will drop a further 50 cents or dollar to touch it?

Silver Monthly Candle Forms a Pinbar (Hammer)August's silver monthly candle completed as a pinbar. This "hammer" gets triggered as a buy signal only if the price moves ABOVE the top of the pinbar by a few cents, or around 25.50 for the December contract. Some traders may buy early by going to the lower time frames of daily or 4 hours and looking for a buy entry midpoint between the close and the bottom which would be around 23.60. (Still, the trade is only considered a buy if the price hits around 25.50!)
Please see my previous idea about what I think is an inverted head and shoulders on the silver weekly chart. A weekly close above around $26 could send silver to $34 or higher.
Sometimes silver does lead gold, so if this trade is triggered expect gold to head higher also even if it is lagging at the time.

Silver bottom, Gold too most likelySilver seems to be bottoming on daily chart. You have a pinbar candle, a way oversold RSI. A reasonable up day/green candle close should be a buy signal in my book.

Managing a silver trade if it moves lowerOctober 4th 2003 10:40 am. It looks like silver is going to make a new low after we found a bullish reversal yesterday. I don't mind a little bit of risk but I go out of my way to avoid large stops... so this is how I would manage a trade based on that. It does require looking at price action and retest of gaps or failure to retest gaps to help me make trade decisions.

Silver had a reversal today should be going higherOctober 3rd 2023 Yesterday I put a target area for where silver would stop going lower and start moving higher. It did that earlier this morning and what I mean by that is the market opens up around 6:00 pm I believe after the session break and sometime last night it went lower and then it reversed. Now it's only up a little bit and I think that it will continue going higher but there's always a chance that we could have a bear Flag and makes a new low... but we have a Contingency plan if that happens. I wanted to spend time on the importance of an ABCD pattern to help me find a reversal.... and I wanted to spend some time looking at expanding markets.... thinking that many traders don't know what that is so they can't react what they can't see.... so I wanted to articulate it from my point of view.
ABCD patterns
Expanding markets

Is this a buying opportunity in silver?October 2nd 23: In this video we see the market lower than it was last night. I changed some of the chart in a little bit because I didn't like one of the ABCD patterns... so I explained that. I changed the range boxes a little bit.... when the market went a little bit lower I visualized it a little differently.... so I changed that. The market went lower and on a smaller than usual time frame... the 2-hour chart, I could see that there was a 1.618 extension that was touched reversal pattern....And then I went into rant About small stops.Markets like this can produce two or three bear flags meaning that the market finds buyers but it quickly makes a new low. the bear flag is an indicator to me that I have the right idea because the market did go higher but I was just a little bit too soon and the market made a new low... and sometimes I might hesitate or even wait on a trade and avoid the bear flag that makes a new low.... but sometimes that trade didn't make a new low and then I'm glad I took the trade. My thinking when the markets are like this is that I think the market is going higher but it's not quite at that support area or that extension that I'm looking at And if I don't take the trade I'll miss the reversal. sometimes it pays to take the trade even though there's a better trade location below The current price.The way this market looks on this video is that it could go higher from this point but it wouldn't surprise me if it gets down to that support area or to the Measured move. I do believe however that the market is in the ballpark for a reversal and I know for a fact I will not have a large stop. In this case I'll be buying physical depending on the price I get from my broker. The other reason for metals to go down could be because the general market is very weak and professional funds have to liquidate a lot of their positions because they're overextended and that means they may have to close Gold or silver positions.... and some firms sell the paper and you can't see them buying the physical.

Silver Daily "Demand" LONGVery incomplete analysis here, but looking for confirmation of reversal on low timeframe charts. Additional zone lower, so keep that in mind, but these levels haven't been seen in quite some time and there was an imbalance favoring buyers last time we were here, so consider a buy despite very negative headlines, recent USD strength, etc. Stepping in front of momentum, though, so use good judgement re: sizing. Also may want to consider mechanical profit scaling @ 1:1 + holding runners. Will revisit/update later.
JHart @ LionHart Trading

Silver near to bearish zone if breaks 0.50 Fib level & TrendlineSilver has touched trendline of 1 day TF and broke trendline of 1hr TF. If it breaks further we can expect a big fall in Silver. Reason is break of trendline and 0.50 Fib level which are important levels.
Be cautious in trading silver and lets wait for the next move of Silver to decide the trend.
Follow me to get further updates on what should be the next step. Your thoughts are welcome.

Silver Bobby's homework assignmentOctober 1st 2003 I missed the incredible price action on Friday.... I just wasn't looking. This is a great example of an expanding market that not only went $5,000 higher but it corrected $5,000 lower.... if you are a great stop and reverse trader you should have had a real nice day..... or if you missed the opening trade higher..... there would be a reason to short it looking at the tools we use and having as good a day as the buyer had in the morning.I thought it was useful to draw some lines on the chart explain how I would handle the market when it opens. I ran out of time before I got to say this... normally I would look to go long if the market opened up on Sunday night since it's at a support area... and I would definitely keep a small stop.... but if the market starts to make a new low after the open it may actually go to the bottom box that I put on the chart.... but this is a tricky market because it's at a support resistance level and the market makers can really trick you on this market because it may stay at support or it may trade lower to the ABCD pattern that brings it to the lower level.... so you have to be careful. on the other hand this market is expanding when it can have a $5,000 move higher and in the same day have a $5,000 move lower...... expanding markets are a good thing but you have to be careful and just like Friday you may not like a trade signal because you don't trust it.... and so you may miss an opportunity.....But follow the markets frequently have two opportunities... if you miss it as a buyer or a seller.... it may very well give you an opportunity as a seller or a buyer. It looks like it's going to be an active market with a setup like this.... time will tell.

Silver: Breaking six Weeks lowSilver breaking its last 6 weeks low.
commodity broke down from its symmetrical triangle.
A pull back can be expected from 67441 levels but not to an extent to reach to triangle trendline levels
Key levels to watch :
Supports: 67441, 65222, 63453. Resistance: 72109, 74741.

SILVER, This Crucial FORMATION is About to Activate the BEARS!Hello There!
Welcome to my newest analysis of SILVER from several timeframe perspectives. The recent determinations within the SILVER price are so severe that I saw no other approach besides deeply analyzing the current bearish indication within my analytics backend and approaching the most acute indications here. Especially, as SILVER is emerging with these heavily accelerated bearish pullbacks liquidating the bulls in the market and penetrating the still remaining supports the major bearish dynamics are increasing more and more and should not be underestimated.
The DXY, U.S.-Dollar Index is trending towards the upside with one new higher after the other together with the more than $100 Trillion market-cap bonds market trending towards the upside this is setting up a huge bearish sentiment for the asset of SILVER as investors open interest declines in SILVER and the bears are expecting the bulls to be roasted. In chart terms this means that SILVER on the weekly timeframe perspective is building this gigantic descending triangle foramtion that will be completed with a final breakout below the lower boundary and from there on the major bearish targets of 19.015 will be the minimum target of this gigantic descending triangle formation.
There are also many other factors that indicate the major bearish breakout and net long-liquidation scenario to emerge in the next times especially because SILVER is forming this major wave count on the lower timeframe perspectives with the bearish wave A setting the momentum of the bearish wave count. Now within this local wave-count SILVER is forming the ascending wedge as the main flag pole bearish wave B that is going to set up the origin of the bearish wave C extension once it has been completed. Together with the descending triangle, this is going to be a double confirmation, the major descending triangle on the weekly, and the bearish wave count on the local.
Taking all the factors into consideration here, SILVER is in a highly bearish condition with the major market developments decreasing the net-long open interest in SILVER as well as the grievous bearish formations that are setting up the next bearish waves to emerge within the next times. In this case, once the bearish momentum curve accelerates into the final target zones it will be important to determine how SILVER continues from there on because with a massive bearish pressure, there is also the potential that SILVER just continues beyond the target zones.
In this manner, thank you everybody for watching my analysis of SILVER. Support from your side is greatly appreciated.
VP

Nowhere we went in Quarter-2 in SilverSilver almost exactly reached the beginning of this quarter. Brokerage firms provided significant estimates for this Diwali aim for silver in the INR 75000–80000 price band. Are these goals intended to improve Diwali for retailers? It appears that silver won't be able to close over INR 74,800 for this quarter (Q3-2023/24). There will be an increasing number of buying chances for a new entry. Please don't be concerned if Silver temporarily displays a level of INR 59000 before fulfilling your ambitions of reaching INR 80000 and above.
Stay invested. Stay Cool.

Assessing the Silver Market: Opportunitie and Risk as Q4 BeginsThe Silver market is a mixed bag, and there are several ways traders are looking at this market. The precious metals complex has been under recent pressure with the rising dollar and rising treasury yields, and Silver is nearing the make it or break it point with some of the weakness we have seen this week.
Good News:
With the negative price action the market has seen, there is still some good news for the bulls. For one, Silver is an industrial metal, unlike Gold. This offers more opportunity for the market outside of what is happening with the dollar and yields. Along with that, even when we have seen the market break below the 23.06 retracement level, the trendline support going back to the lows from August of 2022 have held strong.
Bad News:
Even if you are bullish, it is essential to assess the downside risk before entering a market. The trendline support is going to be the key support level that needs to hold for the market to have any chance of a sustained rally. A break and a close below this level could spark additional selling pressure, and there is a lot of room to the downside for the market to try and find support.
As we are looing to head into Q4 and have end of month and end of quarter today, there should be expected volatility in Silver and the other macro markets as well, but keep an eye on this trendline support as we head into what hopes to be a strong Q4!
Check out CME Group real-time data plans available on TradingView here: www.tradingview.com
Disclaimers:
CME Real-time Market Data help identify trading set-ups and express my market views. If you have futures in your trading portfolio, you can check out on CME Group data plans available that suit your trading needs www.tradingview.com
*Trade ideas cited above are for illustration only, as an integral part of a case study to demonstrate the fundamental concepts in risk management under the market scenarios being discussed. They shall not be construed as investment recommendations or advice. Nor are they used to promote any specific products, or services.
Futures trading involves substantial risk of loss and may not be suitable for all investors. Trading advice is based on information taken from trade and statistical services and other sources Blue Line Futures, LLC believes are reliable. We do not guarantee that such information is accurate or complete and it should not be relied upon as such. Trading advice reflects our good faith judgment at a specific time and is subject to change without notice. There is no guarantee that the advice we give will result in profitable trades. All trading decisions will be made by the account holder. Past performance is not necessarily indicative of future results.

Silver upside move started On Our Harmonic pattern indicator based trade setup take trade as explained below :-
Early trades Buy or sell below/ above 23.6 %, safe trades buy or sell above / below 41% , after taking trade next upside or downside levels will be target ,
When reverse buy or sell signal appear then book profit on Target or trail SL to 23.6 % If trailing SL hit then early trade can be taken above or below 23.6 and safe trade can b taken above/ below 41% ..
Please note:-
It's working on news based and volitile market very well so exit if SL hit
Silver is Primed for a Big MoveSilver has been caught in a technical wedge since the all-time highs of April 2011 and the lows of March 2020. Price action in the year of 2023 has started to coil up tightly as prices battle the bottom and topside of the wedge ranges. Moving forward, real interest rate yields, and a slowing Chinese economy will remain major headwinds to silver and the precious metals complex as a whole. Interest rate yields have been breaking out to the upside which have sent prices lower as of late.
With that being said, the 50 Day EMA will provide near term support, and if this level were to fail, the next level to watch would be the 22.55 – 22.75 level on the December 23’ futures contract. The bottom end of the wedge range “Major Trend Line Support” will be the final area of defense for the silver market.
Conversely, if silver can hold the 50 day EMA as support. This shows near term consolidation/strength. We would need to get above 24.00 before we can retest the top end of the wedge range “Major Trend Line Resistance” and this top end will act as a brick wall for the silver market. To understand momentum, as the silver market is approaching major support and resistance levels, a trader can use the Golden Cross, or Death Cross Strategy. The Golden Cross occurs when the 50 day EMA crosses above the 200 day EMA, while the Death Cross occurs when the 50 day EMA crosses below the 200 day EMA.
Check out CME Group real-time data plans available on TradingView here: www.tradingview.com Disclaimers: CME Real-time Market Data help identify trading set-ups and express my market views. If you have futures in your trading portfolio, you can check out on CME Group data plans available that suit your trading needs www.tradingview.com
*Trade ideas cited above are for illustration only, as an integral part of a case study to demonstrate the fundamental concepts in risk management under the market scenarios being discussed. They shall not be construed as investment recommendations or advice. Nor are they used to promote any specific products, or services.
Futures trading involves substantial risk of loss and may not be suitable for all investors. Trading advice is based on information taken from trade and statistical services and other sources Blue Line Futures, LLC believes are reliable. We do not guarantee that such information is accurate or complete and it should not be relied upon as such. Trading advice reflects our good faith judgment at a specific time and is subject to change without notice. There is no guarantee that the advice we give will result in profitable trades. All trading decisions will be made by the account holder. Past performance is not necessarily indicative of future results.

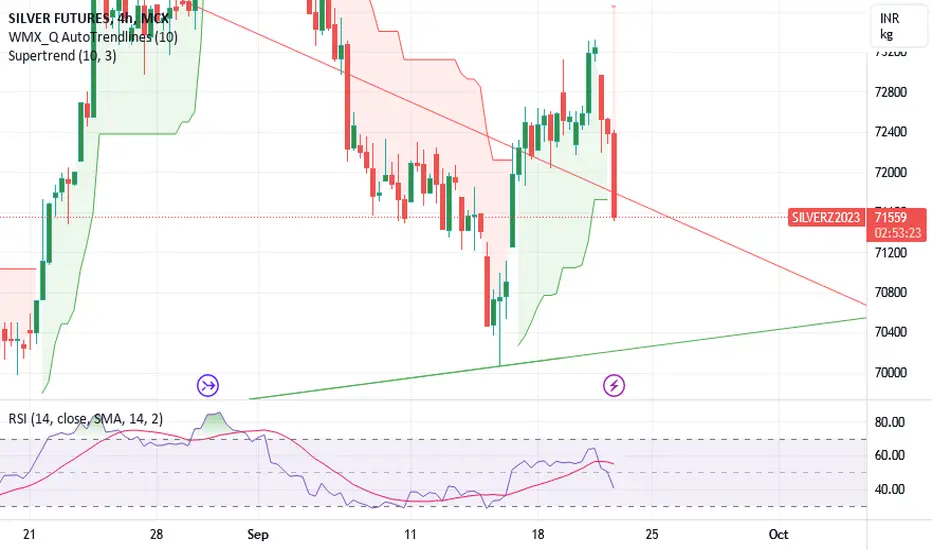
SILVER FUTURES, Pullback-Developments, BEARISH Indication!Hello There!
Welcome to my new analysis about SILVER FUTURES on several timeframe perspectives. The SILVER FUTURES recently showed up with important pullbacks which moved on to test further remaining levels within the whole structure. From a market perspective the bonds market recently showed massive strength with T-bills emerging to form several higher highs and a continued upside movement. This upside movement is also given within the DXY, U.S.-Dollar Currency Index as the DXY continued to form strong movements to the upside putting pressure on the SILVER FUTURES asset.
Within the chart SILVER FUTURES are forming this gigantic bear-flag-formation in which the price action is now testing the lower boundary a next consecutive time, as the boundary has been tested already over four times this increases the possibility for massive bearish pressure to show up once the price action actually formed a breakout below the lower boundary. Within this whole structure as the price action formed several consecutive lower highs and several lower lows a major pullback and continuation with an increase of bearish momentum and bearish pressure to the downside is not uncommon.
With these terms in the perspective there are several important analysis factors to consider within the next times. Especially an further increase within the bonds, t-bills and the DXY will support the bearish scenario for Silver and then it will be necessary to determine the actual momentum setting up. Once the SILVER FUTURES completed the major gigantic bear-flag-formation the target-zones will be firstly within the 20.5 area, after that the 18.5 area, and when the price action reaches such a momentum that a reversal in this area is not possible in any case the next important determining target-zone will be within the 15.5 area. We keep an eye on the dynamics.
In this manner, thank you everybody for watching the analysis, support from your side is greatly appreciated.
VP

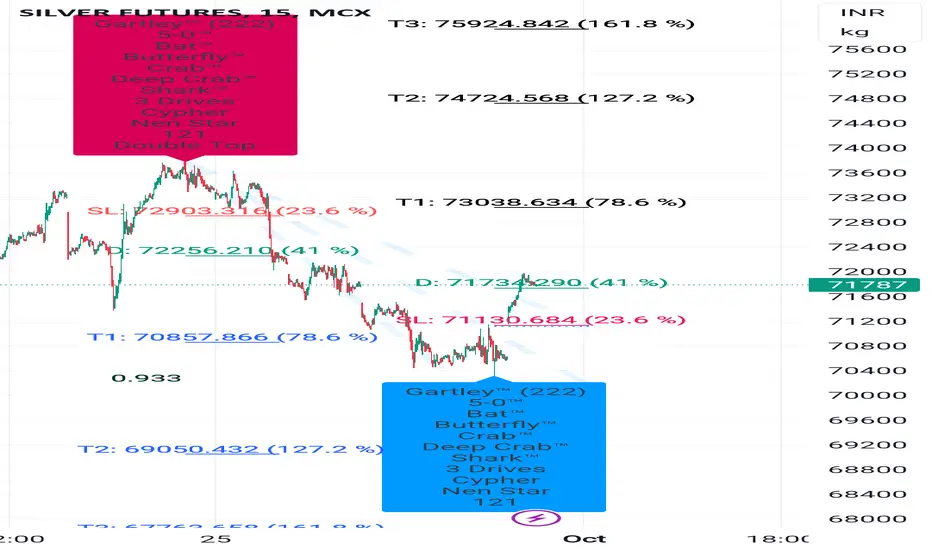
After good upside move silver ready for 75600For all trade on my Auto Harmonic patterns indicator trade setup -
Risky trades can take trade after crossing 23.6% on either side and safe traders can take trade after 41% We can start buying when our Trailing SL hit at 23.6% with SL of recent low our Target will be 41%, 78.6% , 127.2% 161.8% and 223.6 % , when reversal pattern appears on chart we have to trail our SL if trailing SL hit exit from long trade and initiate sell trade ,

Silver Bobby's homework assignmentThis is September 22nd 6:00 Am. I wanted to show you that silver went higher from its open last night and it reached the measured move target. From the opening price last night that's about an $1,800 move. So it paid to take that trade and it added to the profit. I believe it's worth looking at opening price.... but I know that at some point I have to sleep and I can't watch the market 24 hours a day. I always have a stop.... if I enter trade it's entered as a bracket order it has a target and a stop. But that particular entry if I had taken that entry...I would have had a small target... and I would settle for the $1,800 target which I explained in more detail in the video.... that way I go for the profit because it was reasonable, and I get out before there's any chance of a steep reversal against me. It's easy for me to take a trade at 6:00 pm at night because I'm already awake... but it's not so easy to stay at a trade when a few hours later you're not going to be looking at the chart you're going to be sleeping.... and that should factor in to your trading.

silver spot updta eblwsilver spot blw 22.92 expect dwn 22.74--60$ in mcx 71700 blw expect 71400-230 near-- yes already on lower side
Silver What a bear trap looks like.September 21st I think this is a good example of what a bear trap looks like. the market trades down to a support and then it starts systematically trading higher and creating minor higher high and higher low patterns as if it's a trend... suddenly the market takes a steep nose thighs lower.... but not making a new low.... and finds a very quick reversal and almost gets back to where it started in a bar or so depending on your time frame. I would treat it as a manipulation by the smart money to take out the original buyers who were profitable and it does it in one bar. In this case it gave back about $4,000 of a $5,000 trade but very quickly comes back to where the market reverse lower in the first place. Probably tomorrow we'll see this market moving to a new high..... time will tell.
