MELANIA - 15 min - 2 optionsThe price is currently moving near a support level (green line) at around 1.52. This level has stopped the decline several times before, so it could be important for future price movements.
If the price breaks through the green support line at 1.52, further decline can be expected to the next support level (bottom of the red rectangle) at around 1.30.
If the price does not break through the green support line at 1.52, there may be an opportunity for a bounce back towards the red resistance line at around 1.70, than 1.90.
Fibonacci Retracement:
The closest Fibonacci support level is the bottom of the green band at around 1.50. If the price breaks through this level, the next support could be the bottom of the orange band at around 1.30.
RSI Indicator:
Currently, the RSI value is around 40, which does not indicate either overbought or oversold conditions.
Summary:
The MELANIAUSDT.P price is in a downtrend and is currently moving near an important support level at 1.52.
MELANIAUSDT.PS trade ideas

MELANIA - A Big NO!Please! NO to MELANIA, unless some news comes out, its a clear dead cat bounce to eat your liquidity! I said if you anticipate a news, then can do things as such to play but its a clear Dead cat bounce. Stances marked.

Is This the Bottom? MELANIAUSDT at a Critical Turning PointThe Market is at a Crossroads – What Comes Next?
Twelve days ago, MELANIAUSDT.P stood at its absolute high of $14.496, but since then, it has collapsed an astonishing 87.1%, currently trading near its absolute low of $1.865, which was just set today.
The sell-off has been relentless, but is the market about to reverse? Technical indicators are signaling extreme oversold conditions—RSI(14) at 25.23, deep into the danger zone where price often finds a local bottom. The MFI(60) also hovers at 30.98, confirming weak buying pressure, but with a potential for reversal.
Despite this, the asset remains below its key moving averages (MA50 at 2.115, MA100 at 2.252), meaning bulls have significant resistance ahead. Short-term price action is dominated by volume spread analysis (VSA) patterns, showing alternating waves of aggressive buying and selling.
Is this the moment for buyers to step in, or will we see another leg down before any real recovery? With resistance sitting at $1.988 and $2.086, a breakout above these levels could ignite a rapid short squeeze.
Time is ticking—will the market hold this level, or is another flush-out incoming? Stay tuned.
MELANIAUSDT Roadmap: Tracing the Market's Footsteps
Tracking the Market Moves: Key Confirmed Patterns
The price action of MELANIAUSDT has been a rollercoaster, with alternating surges of buy and sell volume dictating the flow. Let’s break down the confirmed patterns that shaped the recent market landscape.
Phase 1: The Build-Up – Buy Side Takes Control
January 27, 08:00 UTC – "Increased Buy Volumes"
Direction: Buy
Open: 2.358 | Close: 2.446 | High: 2.55
Buyers stepped in hard, pushing MELANIAUSDT to $2.55, signaling bullish momentum. This pattern held strong as price action followed through.
January 29, 19:00 UTC – "VSA Manipulation Buy Pattern 4th"
Direction: Buy
Open: 2.3 | Close: 2.309 | High: 2.349
The price maintained upward movement, proving the prior bullish pattern was valid.
Phase 2: The Reversal – Sellers Take Charge
January 29, 18:00 UTC – "Increased Sell Volumes"
Direction: Sell
Open: 2.317 | Close: 2.3 | Low: 2.224
Despite an earlier bullish run, sellers regained momentum, pushing prices lower.
January 31, 15:00 UTC – "VSA Manipulation Sell Pattern 4th"
Direction: Sell
Open: 2.086 | Close: 2.105 | Low: 2.086
The sell-off gained further traction as the price failed to recover above key resistance levels.
Phase 3: The Last Stand – Bullish Bounce Attempts
February 1, 00:00 UTC – "Increased Buy Volumes"
Direction: Buy
Open: 1.935 | Close: 1.936 | High: 2.021
Price briefly bounced, testing $2.021, but lacked follow-through strength.
February 1, 01:00 UTC – "Buy Volumes Takeover"
Direction: Sell
Open: 1.936 | Close: 1.921 | Low: 1.916
Buyers lost the battle, confirming further downside pressure.
What’s Next?
The current technicals suggest we are at a make-or-break point. MELANIAUSDT is hugging its absolute low at $1.865, with resistance lurking at $1.988 and $2.086. The market’s next move will likely depend on whether buyers can reclaim lost ground or if sellers continue to apply pressure.
Stay sharp, watch for volume confirmation, and manage risk accordingly!
Tracking the Market Moves: Key Confirmed Patterns
The price action of MELANIAUSDT has been a rollercoaster, with alternating surges of buy and sell volume dictating the flow. Let’s break down the confirmed patterns that shaped the recent market landscape.
Phase 1: The Build-Up – Buy Side Takes Control
January 27, 08:00 UTC – "Increased Buy Volumes"
Direction: Buy
Open: 2.358 | Close: 2.446 | High: 2.55
Buyers stepped in hard, pushing MELANIAUSDT to $2.55, signaling bullish momentum. This pattern held strong as price action followed through.
January 29, 19:00 UTC – "VSA Manipulation Buy Pattern 4th"
Direction: Buy
Open: 2.3 | Close: 2.309 | High: 2.349
The price maintained upward movement, proving the prior bullish pattern was valid.
Phase 2: The Reversal – Sellers Take Charge
January 29, 18:00 UTC – "Increased Sell Volumes"
Direction: Sell
Open: 2.317 | Close: 2.3 | Low: 2.224
Despite an earlier bullish run, sellers regained momentum, pushing prices lower.
January 31, 15:00 UTC – "VSA Manipulation Sell Pattern 4th"
Direction: Sell
Open: 2.086 | Close: 2.105 | Low: 2.086
The sell-off gained further traction as the price failed to recover above key resistance levels.
Phase 3: The Last Stand – Bullish Bounce Attempts
February 1, 00:00 UTC – "Increased Buy Volumes"
Direction: Buy
Open: 1.935 | Close: 1.936 | High: 2.021
Price briefly bounced, testing $2.021, but lacked follow-through strength.
February 1, 01:00 UTC – "Buy Volumes Takeover"
Direction: Sell
Open: 1.936 | Close: 1.921 | Low: 1.916
Buyers lost the battle, confirming further downside pressure.
Technical & Price Action Analysis
Key support and resistance levels define the battlefield for MELANIAUSDT. If these levels fail to hold, expect them to flip into resistance zones, making upside moves harder.
Support Levels:
1.863 (Critical last low, any break could mean fresh downside)
Resistance Levels:
1.988 (Immediate overhead resistance, must break for bullish momentum)
2.086 (Key level, reclaiming it opens more upside room)
3.306 (Far target, but if bulls wake up, it’s the next big hurdle)
Stay sharp, watch for volume confirmation, and manage risk accordingly!
The price action of MELANIAUSDT has been a rollercoaster, with alternating surges of buy and sell volume dictating the flow. Let’s break down the confirmed patterns that shaped the recent market landscape.
Phase 1: The Build-Up – Buy Side Takes Control
January 27, 08:00 UTC – "Increased Buy Volumes"
Direction: Buy
Open: 2.358 | Close: 2.446 | High: 2.55
Buyers stepped in hard, pushing MELANIAUSDT to $2.55, signaling bullish momentum. This pattern held strong as price action followed through.
January 29, 19:00 UTC – "VSA Manipulation Buy Pattern 4th"
Direction: Buy
Open: 2.3 | Close: 2.309 | High: 2.349
The price maintained upward movement, proving the prior bullish pattern was valid.
Phase 2: The Reversal – Sellers Take Charge
January 29, 18:00 UTC – "Increased Sell Volumes"
Direction: Sell
Open: 2.317 | Close: 2.3 | Low: 2.224
Despite an earlier bullish run, sellers regained momentum, pushing prices lower.
January 31, 15:00 UTC – "VSA Manipulation Sell Pattern 4th"
Direction: Sell
Open: 2.086 | Close: 2.105 | Low: 2.086
The sell-off gained further traction as the price failed to recover above key resistance levels.
Phase 3: The Last Stand – Bullish Bounce Attempts
February 1, 00:00 UTC – "Increased Buy Volumes"
Direction: Buy
Open: 1.935 | Close: 1.936 | High: 2.021
Price briefly bounced, testing $2.021, but lacked follow-through strength.
February 1, 01:00 UTC – "Buy Volumes Takeover"
Direction: Sell
Open: 1.936 | Close: 1.921 | Low: 1.916
Buyers lost the battle, confirming further downside pressure.
Technical & Price Action Analysis
Key support and resistance levels define the battlefield for MELANIAUSDT. If these levels fail to hold, expect them to flip into resistance zones, making upside moves harder.
Support Levels:
1.863 (Critical last low, any break could mean fresh downside)
Resistance Levels:
1.988 (Immediate overhead resistance, must break for bullish momentum)
2.086 (Key level, reclaiming it opens more upside room)
3.306 (Far target, but if bulls wake up, it’s the next big hurdle)
Trading Strategies Based on Rays
The concept of Rays from the Beginning of Movement offers a unique perspective in technical analysis. These rays, built on Fibonacci and geometric principles, help define dynamic levels that guide price movement. Instead of static levels, rays adjust dynamically, ensuring a more adaptive trading approach.
Optimistic Scenario:
If the price interacts with 1.863 and holds, the first target would be 1.988, the second 2.086, and the third 3.306.
Moving Averages confirmation above these levels can signal a continued bullish push.
Pessimistic Scenario:
A breakdown below 1.863 flips it into resistance, opening the path to new lows.
Bearish confirmation via VSA rays and moving averages crossovers would solidify this outlook.
Potential Trades:
Long Entry at 1.863: Targeting 1.988 with a stop below 1.850.
Breakout Trade above 2.086: Aiming for 3.306, stop-loss near 2.000.
Short at Resistance Rejection (1.988-2.086): Stop above the level, targeting previous support.
Watch for interaction with rays before entering trades—these levels define the battleground where market players decide the next big move!
If you have any questions, drop them in the comments! Let’s discuss potential setups, share insights, and improve our trading decisions together. 🚀
Don’t forget to Boost this idea, save it, and check back later to see how price respects the levels I’ve marked—because understanding reaction zones is everything in trading!
My proprietary indicator automatically maps out all rays and levels, but it’s available only in Private Access. If you’re interested in using it, send me a message.
I also provide custom technical analysis on any asset you need. Some analyses I share for free, while others can be private if you don’t want your setup made public. Let’s discuss your request!
Rays work on all assets, and price moves accordingly. If you want a markup for a specific asset, make sure to Boost this post and write in the comments—I’ll do my best to cover it!
Make sure to follow me on TradingView so you never miss a new analysis. All updates and ideas are posted here first! 📈🔥

Official Melania Meme / MELANIAHello guys, this is my smart short idea.
Total supply: 999.99M MELANIA
Max. supply: 1B MELANIA
Circulating supply: 192.21M MELANIA
About Official Melania Meme
Melania memes are digital collectibles intended to function as an expression of support for and engagement with the values embodied by the symbol MELANIA. and the associated artwork, and are not intended to be, or to be the subject of, an investment opportunity, investment contract, or security of any type. melaniameme.com is not political and has nothing to do with any political campaign or any political office or governmental agency. See Terms & Conditions Here
Idea? What say?
I think in short, this go to bottom 1 usdt and maybe less.
Possible move up from here around 6 usdt, maybe go more new ath 40 usdt, long.
Good luck!
This is only my idea guys.
This is not financial advice !
Please do your analysis and consider investing !! Thanks

Melania/USDT Box Range Setup
Melania is currently trading within a well-defined box range, consolidating before the next potential move. If it holds within this structure, we can expect a breakout soon. I’m targeting $3 in the next move, but patience is key.
For now, it’s crucial to watch how price reacts at key support and resistance levels. A dip within the range could be a buying opportunity, but always manage risk accordingly.
Not financial advice, do your own research.

MELANIA COIN RUGPULL!You know the funniest part about the markets this past week?
Some of you really let Donald Trump & the US government drop the biggest rug pull in history! Hope any of you who were silly enough to buy this meme coin, let this be an EARLY INDICATOR & red flag of what the U.S. government got in store for the next few years. Use the puppet Donald Trump to get your hopes up with words, but screw you with actions😂
#MakeAmericaBrokeAgain2025😂

MELANIA USDT💰 #MELANIA
Descending wedge forming near key support, aligning with Fibonacci retracement levels 🐃
Price is expected to rebound strongly from the accumulation zone.
🎯 Target 1: $3.304
🎯 Target 2: $3.743
🎯 Target 3: $4.182
Watch for a bounce—momentum is building for the next leg up 🚀

Mrs President Melania! We Traders for you!!Yeah show your poweer!! Again in a pretty make or break where breaking would lead it to $1.95 and breaking it oh god yes please 3.22 is what you shall pray to break it for.

MELANIEwhat do you think about 1st lady Melanie.
looking like there is money entering in this project, am not sure how much it can go up or if it will go up, but the honor of the 1st lady it will be sent to the place it should be, high...
in 4h TF looks like the downtrend is over.
thinking to open a long position.
NFA
DYOR

Melania Coin (MELANIA): Another Meme Coin Has Done Good Work!MELANIA is dying—well, not dying but liquidity is being taken out heavily from here.
This is a natural movement for this kind of meme coin; did people really think it would be a new super mega coin?
This project most likely will be forgotten; time to search for new ones?
P.S If the Trump family decides to connect their coins to the US, then this might be interesting; other than that, not so optimistic for the coin!
Swallow Team

MELANI- Chart - Identifying Bearish Trend and Potential TradeMELANIA/USDT Chart Analysis
Greetings, let's take a closer look at the MELANIA/USDT chart and unpack the key details:
Overview
The chart displays an interesting pattern - a clear descending channel formation with lower lows and lower highs over the past few days. This suggests a strong bearish momentum in the MELANIA MEME.
Key Levels
1. Resistance: The yellow descending trendline acts as a key resistance level. Breaking above this trendline could signal a potential trend reversal.
2. Support: The zone around $2.65 appears to be an important support area. A break below this could lead to further downside.
3. Stop Loss: Given the bearish structure, a stop loss order placed slightly above the previous swing high at $2.5 would be prudent.
Price Targets
1. TP1: $6.3 - This level represents the 61.8% Fibonacci retracement of the recent downswing.
2. TP2: $7.2 - This is the 78.6% Fibonacci retracement, which is a common target for bullish reversals.
Trading Strategy
Based on the current chart structure, a bearish bias is warranted. A potential trading opportunity could be:
Entry: Short on a break below the $2.6 - $2.8 support zone.
Stop Loss: Slightly above the previous swing high at $2.5
Take Profit 1: $6.3
Take Profit 2: $7.2
It's important to note that the crypto market is highly volatile, so proper risk management is crucial. Always do your own research and analysis before making any trading decisions.

Melania will at least retrace up againStill expecting to see retracement up to 6.23-7.40 minimal.
PA likes to fill longer candles. Upon reversal look for the candle right before any longer candle as a target, here 7.40.

First Lady - Melania's Analysis!So breaking yellow line invites more flow down, ideally pattern drawn what cam happpen!!!

Phemex Analysis #55: How to Trade MELANIA Like a ProThe cryptocurrency world was shaken on January 20, 2025, when Melania Trump, the incoming First Lady of the United States, launched her own meme coin, $MELANIA ( PHEMEX:MELANIAUSDT.P ). Riding the wave of excitement surrounding her husband Donald Trump’s inauguration as the 47th U.S. President, $MELANIA surged to an all-time high (ATH) of $14.50 within hours of its launch, boasting a market capitalization of over $2 billion. However, the hype was short-lived as the token plummeted by more than 76%, stabilizing around $3.40 by January 23. This dramatic rise and fall highlight the extreme volatility of meme coins like $MELANIA.
Now, with traders closely watching its next moves, we explore two possible scenarios for $MELANIA’s price action and how you can trade it like a pro.
Bullish Breakout: A Resurgence in Momentum.
After its sharp decline, $MELANIA may be setting up for a bullish breakout. As of January 23, the token has formed a second low with a higher Relative Strength Index (RSI) compared to its first low on January 21. This signals that buying power is returning to the market. If $MELANIA breaks above the key resistance level of $4 with high trading volume, it could indicate strong bullish momentum and open the door for further gains.
In this scenario, traders should watch for resistance levels at $5, $5.9, $8, $9.2, $10.8, and $12.9 as potential profit-taking zones. Positive sentiment around the token—possibly driven by media coverage or endorsements—could fuel further price increases.
If you’re a short-term trader, consider gradually taking profits at each resistance level to lock in gains during the rally. For long-term holders who believe in the token’s potential or its association with Melania Trump’s public profile, holding through volatility may yield greater rewards.
Bearish Drop: A Chance to Buy the Dip.
On the flip side, there’s also a risk that $MELANIA could face another sharp decline if selling pressure intensifies. If the price falls below $3.29 with high trading volume and a lower RSI (below 19), it could signal further bearish momentum. In this case, psychological levels such as $3, $2, and even $1 might serve as key support zones where traders can look to buy the dip.
However, caution is essential here—if the price slows down near these levels with lower volume and higher RSI compared to previous dips, it may indicate that $MELANIA is attempting to build a support base. This would present an opportunity for traders to accumulate tokens at discounted prices before any potential recovery.
Conclusion.
Trading meme coins like $MELANIA is not for the faint-hearted—it’s a game of high risk and high reward. With its dramatic price swings and speculative nature, this token reflects both the opportunities and challenges of trading in volatile markets.
As Melania Trump garners attention in her new role as First Lady and continues to promote her digital asset, traders should remain vigilant and adapt their strategies based on evolving market conditions. Whether you’re riding bullish waves or buying dips during corrections, staying disciplined and informed will be your greatest advantage.
For those willing to embrace the risks, $MELANIA offers an exciting opportunity to trade one of the most talked-about tokens in crypto history—so gear up and trade MELANIA like a pro!
Tips:
Elevate Your Trading Game with Phemex. Experience unparalleled flexibility with features like multiple watchlists, basket orders, and real-time adjustments to strategy orders. Our USDT-based scaled orders give you precise control over your risk, while iceberg orders provide stealthy execution.
Disclaimer: This is NOT financial or investment advice. Please conduct your own research (DYOR). Phemex is not responsible, directly or indirectly, for any damage or loss incurred or claimed to be caused by or in association with the use of or reliance on any content, goods, or services mentioned in this article.

MELANIAseems that miss melania it is trying to restore the launch price on binance...
thinking that i am opening a long position

Melania/USDT: Is There Hope for Recovery?The chart for Melania/USDT shows a clear descending channel, reflecting the coin's ongoing downtrend. With lower highs and lower lows dominating the action, the price is struggling to break free from this bearish structure. I’ve done my best to chart this with the limited data available since the coin is new.
Key Levels to Watch:
Support : $3.304 serves as the lower boundary and a critical support level to hold. A break below could trigger further downside.
Resistance : $4.146 is the first hurdle within the channel, while $7.097 represents a significant resistance level that needs to be reclaimed for a potential trend reversal.
The descending price channel highlights the controlled nature of this downtrend, with resistance and support levels acting as key points for price action. To all of you who bought at the top, I truly feel bad it’s never easy being on the wrong side of a sharp decline.
For now, the price is testing critical support, and a breakout above the channel is needed to spark hope for recovery. Until then, caution remains the best approach.
What’s your take? Can Melania/USDT find its way back, or is the downtrend here to stay? 🚀 or 📉?

Melania Gann Analysis **Understanding Gann for Beginners – Let Me Simplify It for You**
Hey everyone! I know Gann charts can look super complex at first glance, but let me break it down step by step so anyone can understand it.
---
### **1. Gann Levels – Price Divided into Angles**
Gann analysis divides price into specific angles, like **0°, 45°, 90°, 135°**, and so on. Each of these angles represents a price level that’s important for support, resistance, or trend continuation.
- **What do these angles mean?**
- **0°:** This is our base or starting point. In this chart, it’s **7.41 USDT.**
- **45°:** This is one of the most important angles. If the price crosses it, it often signals strength. In this case, it’s **12.34 USDT.**
- **90°, 135°, 180°:** These are higher levels of resistance or target zones. The higher the angle, the stronger the resistance.
Think of these levels like **checkpoints** for the price. If the price breaks one, it’s aiming for the next. If it bounces off, it might reverse back down.
---
### **2. Time Cycles – When Things Happen**
Gann doesn’t just focus on price; it also looks at **time.** The vertical purple lines on this chart represent key time cycles. These are moments when you can expect:
- **Reversals** (price changing direction),
- Or **stronger trends** (price speeding up).
For example, look at the **yellow star on 24 Jan 2025 at 13:28.** That’s a point where the market might react significantly based on Gann’s methods.
---
### **3. Price + Time = High Probability Zones**
Gann’s magic happens when **price levels** and **time cycles** align. If the price is near a key angle (like **45° = 12.34 USDT**) at the same time as a time cycle (like one of the purple lines), you’re more likely to see a significant move.
This is where Gann gives us an edge: knowing not just where the price might react, but **when.**
---
### **4. Support and Resistance – Keep It Simple**
In Gann, each angle acts as either:
- **Support:** Where the price might stop falling and bounce up.
- **Resistance:** Where the price might stop rising and reverse down.
Here are some examples from the chart:
- **Support levels:**
- **0° = 7.41 USDT** (strong base),
- **22.5° = 9.72 USDT.**
- **Resistance levels:**
- **45° = 12.34 USDT,**
- **90° = 18.52 USDT.**
Watch how the price behaves when it hits these levels. If it breaks above resistance, it’s likely heading to the next angle. If it can’t, it might fall back to the previous level.
---
### **How to Read This Chart Like a Pro**
1. **Start with the Base Price:**
- The starting price here is **7.41 USDT (0°).**
2. **Follow the Price Checkpoints:**
- As the price climbs, keep an eye on these levels:
- **22.5° = 9.72 USDT,**
- **45° = 12.34 USDT.**
3. **Watch the Time Cycles:**
- The vertical purple lines mark moments when the market might react.
- Combine these with price levels for higher accuracy.
4. **Look for Reactions:**
- If the price reaches **22.5° (9.72 USDT)** near a time cycle, it could break through or reverse back to **0° (7.41 USDT).**
---
### **Imagine Gann as a Ladder**
Here’s an easy way to think about it:
- **0° = The base of the ladder.**
- Each angle (22.5°, 45°, 90°, etc.) is a step on the ladder.
- The price climbs up the ladder, testing each step. If it slips, it falls to the step below. If it breaks through, it climbs higher.
---
### **Why Does Gann Work?**
Gann believed that markets are influenced by natural laws, like geometry and time. While it’s not a guarantee, it gives us a structured way to think about price and time. It’s all about identifying **key levels** where the price is most likely to react.
---
### **Final Tips for Beginners**
- **Focus on the Key Levels First:** Start with 0°, 45°, and 90°. These are the most important.
- **Use Time Cycles:** Pay attention to the purple lines – they show when to expect reactions.
- **Combine Gann with Other Tools:** Look for candlestick patterns, trendlines, or volume to confirm your trades.
---
Let me know if this helped! If you have questions, feel free to ask, and let’s discuss how we can use Gann to trade smarter together. 😊

MELANIA - Don't touch it!Just don't. This is super high risk, brand new. Possible trend line break coming to the upside. This is 10/10 risk. Keep your powder dry. Follow for more.

Perfect buy opportunity melania coinTechnical and Market Analysis: Global Trade Empire: $MELANIA Coin
Technical Analysis
• Blockchain Platform:
The $MELANIA coin is built on the Solana blockchain, which is known for its high speed and low transaction costs, ensuring scalability for high trade volumes.
• Tokenomics:
• Initial supply: 200 million tokens.
• Planned supply over 3 years: 1 billion tokens.
• Significant portions are held by entities affiliated with the Trump Organization, with revenue generated from trading activities.
• Market Performance:
• Launch Price: $12.03 per coin.
• Market Capitalization: ~$1.9 billion at launch.
• Competitor Impact: The launch briefly caused a 40% dip in the $TRUMP token’s value, but $TRUMP recovered and reached $58.56 per coin, maintaining an $11.7 billion market cap.
Market Analysis
• Investor Sentiment:
$MELANIA has attracted significant attention, particularly from Trump supporters and the cryptocurrency community. However, memecoins are speculative and prone to volatility.
• Regulatory Considerations:
The association with the Trump brand raises ethical and regulatory concerns, especially given the ties to a sitting U.S. president. Critics argue this opens doors to influence from special interests and foreign entities, highlighting the need for transparency.
Conclusion
The $MELANIA coin expands the Trump brand into cryptocurrency, mirroring a growing trend of celebrity-backed digital assets. While its initial market performance is promising, investors should be cautious due to the volatile nature of memecoins and potential regulatory challenges.

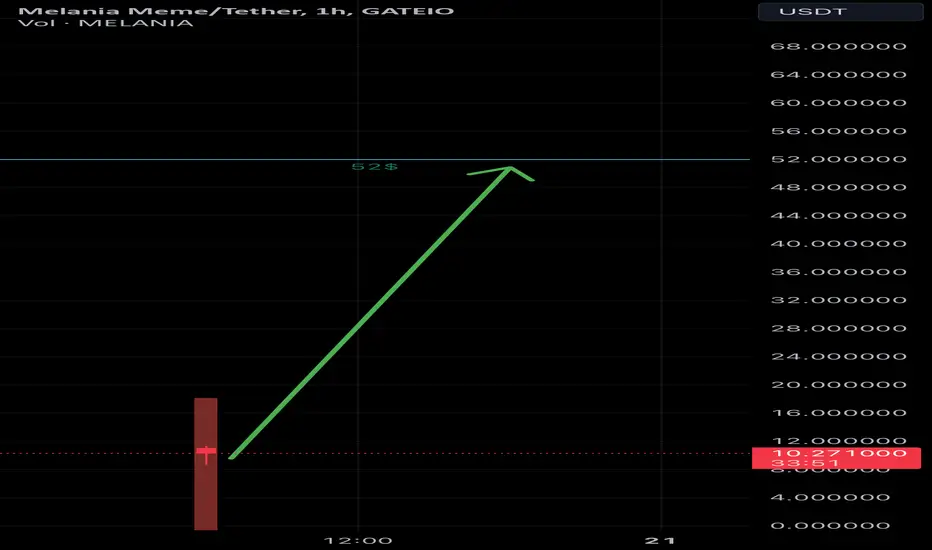
MELANIA is preparing to launch rocketNew MEME from Donald Trump family. MELANIA will explode soon! The first target is near 52$. Let’s make History. Crypto super cycle just start!