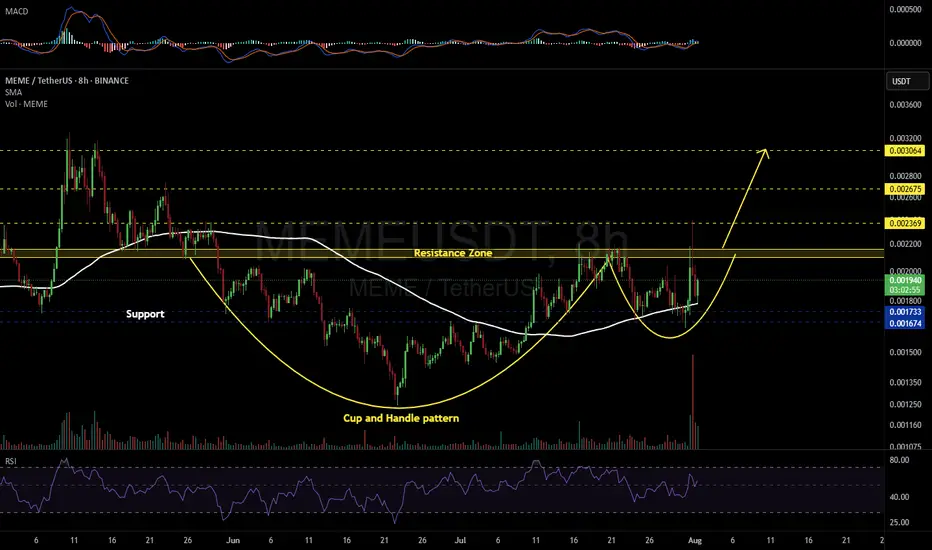
MEMEUSDT 8H#MEME has formed a Cup and Handle pattern on the 8H timeframe. It has bounced nicely off the SMA100, and volume is showing signs of strong accumulation.
📌 Consider entering this coin only after a solid breakout above the resistance zone.
If the breakout occurs, the potential targets are:
🎯 $0.002369
🎯 $0.002675
🎯 $0.003064
⚠️ As always, use a tight stop-loss and apply proper risk management.
MEMEUSDT trade ideas
15% for MEME soonMEME is showing strength as market is bullish, I am expecting continuation with 15% minimum gain tomorrow.
NOT A FINANCIAL ADVICE
MANAGE YOUR RISK AND ALWAYS USE STOPLOSS

Long MEMEMEME has returned to its consolidation range and is currently bouncing off the range low.
LONG setup is as in chart.
Disclaimer:
This analysis is based on my personnal views and is not a financial advice. Risk is under your control.

Trend Reversal Confirmed? MEME/USDT Bulls Take ControlThe MEME/USDT chart is showing a highly compelling technical setup. Here are the key points of the analysis:
1. Breakout from Long-Term Downtrend:
Price has successfully broken above a descending trendline that has been in place since November 2024. This breakout marks a potential end to the prolonged bearish phase and opens the door for a new bullish trend.
2. Strong Accumulation Zone:
A clear accumulation zone is visible between $0.00130 – $0.00160, lasting from May through late June 2025. This zone now serves as a strong support area.
3. Formation of Higher Lows:
After the breakout, price action has begun to form higher lows — a bullish signal indicating that buyers are stepping in.
4. Potential Upside Targets (Key Resistance Levels):
The chart outlines several key resistance levels that may serve as short- to mid-term targets:
$0.001996
$0.002608
$0.003074
$0.003987
$0.004764
$0.007136
$0.010259
$0.017863
$0.018690 (previous high)
5. Bullish Scenario:
If bullish momentum continues with strong volume, price could follow the projected upward zigzag pattern and move through these resistance levels progressively.
6. Risk Management Note:
A breakdown below the accumulation zone ($0.00130) would invalidate the bullish scenario and should be watched closely.
✅ Conclusion:
MEME/USDT is displaying strong reversal signals after breaking out of a long-term downtrend and consolidating in a solid accumulation range. If buyer momentum continues, we could see significant upward moves toward key resistance zones.
#MEME #MEMEUSDT #CryptoBreakout #AltcoinAnalysis #BullishReversal #TrendlineBreakout #CryptoTrading #TechnicalAnalysis #AltcoinSeason #ChartPattern #CryptoSignals

MEME – A Volatile Bet with Upside Potential
If the altcoin season thesis remains valid, MEME could be one of the more promising—albeit high-risk—opportunities.
In past cycles, coins like DOGE, SHIB, and PEPE delivered explosive gains in very short periods.
What’s missing now is the clear ignition of altcoin season. Be patient.
Disclaimer:
This analysis is based on my personnal views and is not a financial advice. Risk is under your control.
MEMEUSDT 1D AnalysisMEME ~ 1D Analysis
#MEME Buy back gradually from here if you still have confidence in this coin with a short term target of at least 15%+ from here.

MEMEUSDT 1D AnalysisMEME ~ 1D Analysis
#MEME Buy on retest of this support block with short term target of at least 15%+ from here.

#MEME #MEMEUSDT #MEMECOIN #LONG #SWING #Eddy#MEME #MEMEUSDT #MEMECOIN #LONG #SWING #Eddy
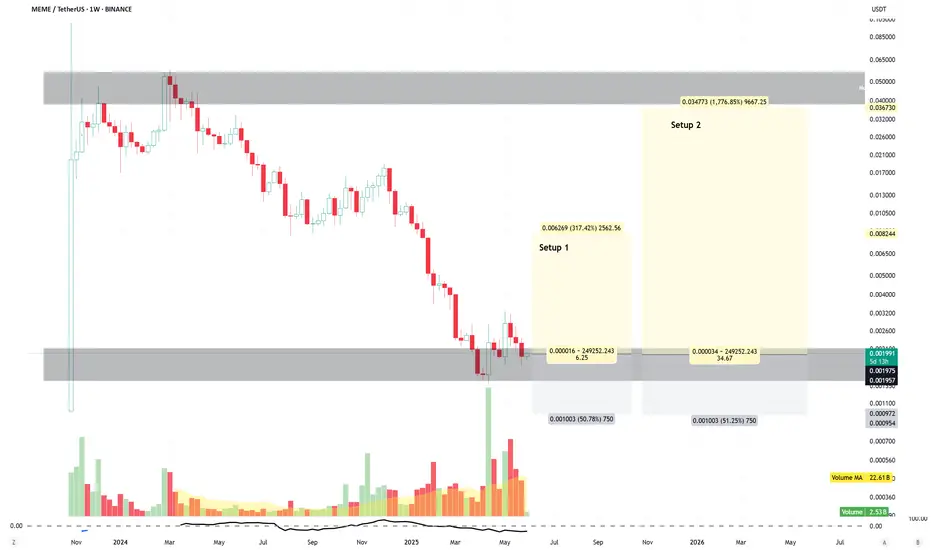
MEMEUSDT.P SWING Long Setup
Important areas of the upper time frame for swing are identified and named.
This setup is based on a combination of different styles, including the volume style with the ict style.
Based on your strategy and style, get the necessary confirmations for this Swing Setup to enter the trade.
Don't forget risk and capital management.
The entry point, take profit point, and stop loss point are indicated on the chart along with their amounts.
The responsibility for the transaction is yours and I have no responsibility for not observing your risk and capital management.
By scratching the price and time bar, you can see the big picture of targets.
Buy Position "LONG" Spot & Future Details :
Entry : 0.002662
Stop : 0.002616 (( 1.73% ))
Target 1 : 50% Spot
Target 2 : 100% Spot
Target 3 : 500% Spot
Target 4 : 1000% Spot
Target 5 : 1500% Spot
Target 6 : 2000% Spot
Be successful and profitable.

MEMEUSDT:- Pennant Breakout coming up.BINANCE:MEMEUSDT - Breakout to the upside coming up in meme once it reaches the edge of the triangle. Expecting a huge upside. Keep watching the edge of the triangle in the days to come. Thank You!

$MEME: Ready for a 40X Moonshot? Ticker: AMEX:MEME
Current Price: $0.002
Target: $0.08 (40X potential)
Why AMEX:MEME ?
AMEX:MEME is the ultimate community-driven token, riding the wave of viral hype and meme culture. With a passionate X community, upcoming NFT integrations, and a low market cap, this micro-cap gem is primed for explosive growth.
Technical Setup:
Strong support at $0.0018, forming a solid base.
RSI showing oversold conditions, signaling a reversal.
Breakout above $0.0025 could ignite a parabolic run.
Catalyst :
Rumored partnerships and exchange listings.
Meme coin mania is back— AMEX:MEME is positioned to outperform.
Trade Idea:
Buy at $0.002, set stops below $0.0018, and target $0.08 for a potential 40X. Manage risk—this is a high-reward play!

MEME Main trend -97% Channel. Reversal or scam zone.Logarithm. Time frame 3 days (less is not needed).
🟡 The price has reached a decline from the highs (not a listing squeeze) -97%. These are practically the maximums of declines after the hype for cryptocurrencies of such liquidity (96-98), after which there is only a complete scam. At the moment, there is a reaction from this zone (the lower zone of the main trend channel) (impulse buyback), and a rollback after it, which forms the canvas of a potential ascending flag. If there is a breakthrough, then locally - the implementation of the ascending flag.
⚠️🔼 These are high-risk cryptocurrencies of such liquidity (that's why such declines are big), but the percentage of price growth in them, for the same reasons (liquidity/volatility) is an order of magnitude greater in the case of their implementation. When working with such assets, observe money management.
🟣 Implementation of the flag's goals (essentially to the channel median) +80-100%
🟡 To the resistance of the descending channel of the main trend +325%
🔵 To potential highs (one of the previous consolidations) +1000-1300%.

MEME/USDT: BREAKOUT ALERT!!🚀 MEME Breakout Alert – 40%+ Potential Incoming?! 👀🔥
Hey Traders! If you're all about high-conviction plays and real alpha, smash that 👍 and tap Follow for more setups that actually deliver! 💹💯
🚀 AMEX:MEME / USDT Long Setup – Breakout Watch! 🚀
AMEX:MEME is squeezing inside a symmetrical triangle on the 1H chart and is now testing breakout levels! Get ready for a potential explosive move! 📈⚡
📊 Trade Setup:
✅ Entry: CMP and add more in dip
✅ Targets:
• Target 1 → $0.00260
• Target 2 → $0.00290
• Target 3 → $0.00302+
🛡 Stop Loss (SL): $0.00207 (below triangle support)
📌 Why this setup?
Tight consolidation near apex
Strong EMA support
Previous breakout gave ~40% move!
⚠️ Risk management is key! Wait for confirmation, and always stick to your SL.
💬 Share your thoughts below — bullish or cautious on MEME? Let’s discuss! 👇👇

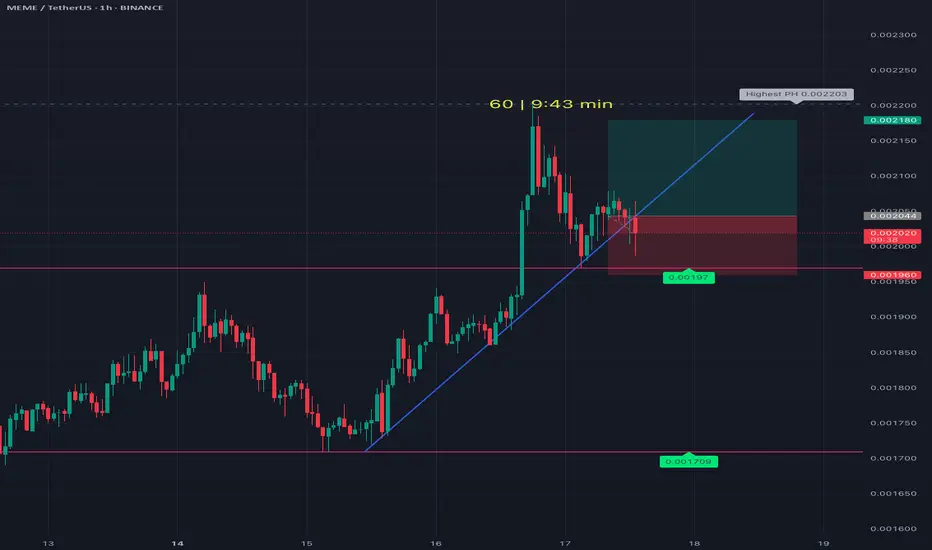
MEME/USDT Analysis — Symmetrical Triangle Breakout + Golden CrosMEME/USDT Analysis — Symmetrical Triangle Breakout + Golden Cross! 🚀
Timeframe: 4H
Exchange: Binance (Perpetual Contract)
Chart Type: Heikin Ashi
📊 Technical Analysis:
A Symmetrical Triangle formation is visible, suggesting a potential strong breakout.
Golden Cross observed: EMA 50 (yellow) is crossing above EMA 200 (red), a strong bullish signal.
Price currently consolidating near the triangle apex — a breakout is expected soon.
⚡ Trading Plan:
📌 Bullish Scenario:
✅ Entry: Above 0.002200 (candle close confirmation)
🎯 Targets: 0.002400 — 0.002600
🛡️ Stop Loss: 0.002041 (below 50% Fibonacci level)
📌 Bearish Scenario:
✅ Entry: Below 0.002041 (candle close confirmation)
🎯 Targets: 0.001887 — 0.001675
🛡️ Stop Loss: 0.002166 (previous consolidation zone)
📰 Fundamental Catalysts:
Market Sentiment: Meme coins seeing increased social media attention (Reddit, Twitter).
Binance Update: Funding rate adjustments may trigger volatility.
Hype Cycle: Growing interest towards MEME tokens as April ends.
📢 Summary:
MEME/USDT is at a critical breakout point with Golden Cross support. Watch for volume confirmation and manage risk properly.
Risk Management is Key! ⚠️
#Crypto #MEME #TradingView #Altcoins #TechnicalAnalysis
Not a financial advise #DYOR

MEME price analysis⁉️ Maybe #MEME is trying to start the memecoin 2.0 season?)
Before the strong resistance from above, the growth potential is 400%, but even this will not be much consolation for those who bought OKX:MEMEUSDT a year ago.
But again, in accordance with the assumption that was written a few posts earlier: coins with market caps in the range of $50-100 million are starting to “pumping”.
💰 In general, if the CRYPTOCAP:BTC price in April is kept above $79-80k (9 days left), then May may turn out to be quite generous.
_____________________
Did you like our analysis? Leave a comment, like, and follow to get more

#MEME/USDT#MEME
The price is moving within a descending channel on the 1-hour frame, adhering well to it, and is on its way to breaking it strongly upwards and retesting it.
We are seeing a bounce from the lower boundary of the descending channel. This support is at 0.001424.
We have a downtrend on the RSI indicator that is about to break and retest, which supports the upward trend.
We are looking for stability above the 100 moving average.
Entry price: 0.001452
First target: 0.001496
Second target: 0.001537
Third target: 0.001586

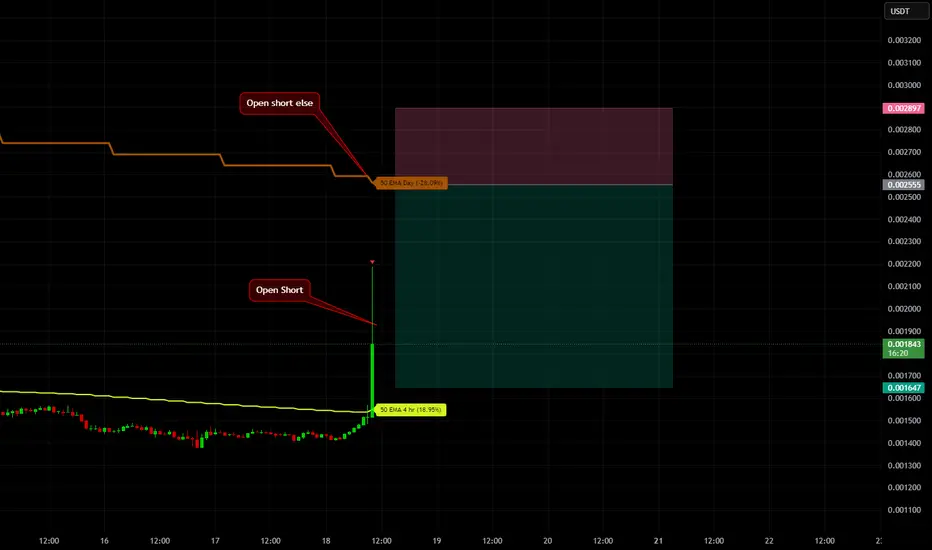
MEMEUSDT ShortMEMEUSDT had a strong breakout from the 4H EMA50 — up 23%! This setup is perfect for a short without a stop, using scaling in.
There’s a chance price might reach the daily EMA50 — if it does, I’ll add more to the short from there. The target will be adjusted based on how the 4H EMA50 moves.
Meme - Pump?I know a person who is has drowdown position in a 98 percent
Do you think there will be a Pump?

#memeA good opportunity for a very good drop. It will definitely go to the third target and even lower.

#MEME/USDT#MEME
The price is moving in a descending channel on the 1-hour frame and is adhering to it well and is heading to break it strongly upwards and retest it
We have a bounce from the lower limit of the descending channel, this support is at a price of 0.00284
We have a downtrend on the RSI indicator that is about to break and retest, which supports the rise
We have a trend to stabilize above the moving average 100
Entry price 0.00309
First target 0.00334
Second target 0.00355
Third target 0.00381

#MEME/USDT#MEME
The price is moving in a descending channel on the 1-hour frame and is adhering to it well and is heading to break it upwards strongly and retest it
We have a bounce from the lower limit of the descending channel, this support is at a price of 0.00424
We have a downtrend on the RSI indicator that is about to break and retest, which supports the rise
We have a trend to stabilize above the moving average 100
Entry price 0.00442
First target 0.00460
Second target 0.00475
Third target 0.00492

#MEME/USDT#MEME
The price is moving in a descending channel on the 1-hour frame and is expected to continue upwards
We have a trend to stabilize above the moving average 100 again
We have a descending trend on the RSI indicator that supports the rise by breaking it upwards
We have a support area at the lower limit of the channel at a price of 0.00670
Entry price 0.00694
First target 0.00725
Second target 0.00751
Third target 0.00783

MEME This currency has the possibility of patterning the corner and observes the rule of 3 edges and made a lot of corrections. It has the ability to grow a lot
