MEMEUSDT 4DMEME ~ 4D
#MEME This trade is high risk. But if you still have Conviction on this coin,. This is a very good support block for now,. Buy in stages with a minimum target of 20%++
MEMEUSDT trade ideas

#MEME/USDT#MEME
The price is moving in a descending channel on the 1-hour frame and is expected to continue upwards
We have a trend to stabilize above the moving average 100 again
We have a descending trend on the RSI indicator that supports the rise by breaking it upwards
We have a support area at the lower limit of the channel at a price of 0.00810
Entry price 0.00890
First target 0.00937
Second target 0.00990
Third target 0.01050

MEME TO LONG MEME is making a cup and handle on 15min , plus a channel breakout can also be seen .
a long entry can be taken
Entry : 0.014680
Tp : 0.017150
stoploss :0.013365

meme/usdt1. Chart Pattern
Triangle Pattern: The price movement appears to be forming an ascending triangle pattern. This pattern typically indicates a potential breakout.
Lower Trendline: There is an ascending support line where the price is consistently finding support.
Upper Resistance Line: The resistance level is around 0.01235, which acts as a ceiling for the price.
2. Support and Resistance Levels
Support Levels:
0.01114: A strong short-term support level.
0.01098: A secondary support level below.
Resistance Levels:
0.01235: The key resistance level that needs to be broken for further upward movement.
3. Indicators
RSI (Relative Strength Index):
The RSI graph below fluctuates between 30 and 70, indicating that the market is neither in an overbought nor oversold zone.
The current RSI is near the mid-level, suggesting neutral momentum. An upward movem
Volume:
The 24-hour volume shown is 320.53 million.
If the volume is low, the breakout from the triangle pattern might lack strength. A high-volume breakout would provide more reliability.
4. Performance Data
In the performance section on the bottom right:
1D (1 Day): +10.05% increase.
1W (1 Week): -29.46% decrease.
1M (1 Month): -17.19% decrease.
This indicates a short-term recovery attempt within an overall bearish trend.
5. General Outlook
Short-Term Expectation:
If the price holds above the 0.01114 support level and breaks upwards with significant volume, the next target would be the 0.01235 resistance level.
Long-Term Risk:
If the 0.01114 support level is broken to the downside, the price could drop further to 0.01098 or lower levels.

TradeCityPro | MEMEUSDT Potential Breakout from the Range Box👋 Welcome to TradeCityPro Channel!
Let’s dive into analyzing our coins in the current market conditions to identify potential triggers before the next move begins.
🌐 Overview Bitcoin
Before starting today’s altcoin analysis, as usual, let’s first check Bitcoin on the 1-hour timeframe. Bitcoin has finally initiated a wave, breaking through the 95753 resistance.
However, I’m not fond of the volume in these recent candles, and it needs to increase. You can consider opening positions upon entering the overbought zone.
Additionally, today saw a short-term wave with some green candles, accompanied by a decline in Bitcoin dominance. Now, as Bitcoin prints green candles, its dominance is also rising, indicating that the next wave moving toward Bitcoin’s peak might come with increased dominance.
📊 Weekly Timeframe
On the weekly timeframe, the altcoin MEME rejected the top of the range and the significant 0.01790 resistance, pushing it back toward the range’s bottom.
The buy trigger hasn’t activated yet, and this rejection has made the trigger even more critical. If you’re interested in buying this altcoin, consider adding it to your mid-term portfolio after breaking 0.01790.
If you’ve already bought at any level on this chart, it’s logical to exit and cut losses if the range’s bottom breaks. A break below 0.00997 would suggest forming new lows, so it’s better to liquidate and look for a fresh trigger later.
📈 Daily Timeframe
On the daily timeframe, following a heavy rejection from the 0.1795 resistance, MEME returned to the range, resulting in continued oscillations within this area.
We must consider that, price-wise, the market is at a logical level for buying. However, time-wise, it might range here for a while before starting a potential upward move. This makes it somewhat reasonable to take small spot risks during these days.
Based on the above, you can make a risky buy at 0.01132, with a stop-loss at 0.00861, after breaking the level. However, personally, I’ll hold onto liquidity for lower levels.
For example, if I have 30% of my funds in cash, any purchases I make here would amount to just 5% overall, assuming stop-losses are hit! For a more logical entry, I’ll monitor for a break above 0.01795.
⏱ 4-Hour Timeframe
On the 4-hour timeframe, MEME has been ranging for days within the 0.01007–0.01139 box. A breakout from either side of this range will provide a clear trigger without bias.
📈 Long Position Trigger
the rejection at the 0.01139 resistance has increased its significance. Once this level breaks, I’ll open a futures long position with a large stop-loss at 0.01.
📉 Short Position Trigger
momentum can be tracked on lower timeframes, and positions can be opened with triggers on these smaller timeframes. The 0.01 support level could be used for a small stop-loss and low-risk, quick profit management.
📝 Final Thoughts
Stay calm, trade wisely, and let's capture the market's best opportunities!
This analysis reflects our opinions and is not financial advice.
Share your thoughts in the comments, and don’t forget to share this analysis with your friends! ❤️

update I'm sorry, wave counting is a very difficult task and technical analysis is generally associated with mistakes.
The idea of wave 4 was wrong on my part. We had a big correction in wave 2. The good news is that in wave 3, the minimum target is 0.031.
I will update at the end of wave 1 of the big 3.

"Breakout Confirmed: MEME/USDT Poised for 250% Gains – Don’t MisHere’s an overview of the MEME/USDT chart, pointing out its potential to increase in value by 250% or more in the next few months.
Important Findings
Breaking above a downward trend line.
A clear downward trendline was crossed in early November 2024, showing a change from a negative to a positive outlook.
After the price increased, it has now become steady, which means people might be gathering more before the next big change.
Important Support Points:
0. 01262 (current breakout level): This is a key level for support right now.
Below this, 0. 01200 acts as strong support, keeping the price above important low points.
Important Levels Where Prices Might Stop Rising (Target Areas):
0. 02122: The first big obstacle. If it goes above this point, it could start a big rise.
002500: The next goal after breaking out, which is the same as the last highest point.
003311: A medium-term goal that matches earlier supply areas.
004732: This is the last key resistance point, which could lead to a profit of about 250% to 300% from the current price.
MACD Analysis: Understanding MACD is about looking at two moving averages to help predict the price trends of a stock. It can tell us when to buy or sell by showing the momentum of price changes.
The CM_Ult_MACD and MACDRe indicators suggest that momentum is slowing down and may start to go up soon.
When the histogram shows positive divergence and the red bars are getting smaller, it might mean that there is a chance for more upward movement in the market.
Amount and Market Setup:
The amount of trading seems stable after the price went up, showing that the market is settling down.
A big increase in trading activity when prices go up can show that investors are interested and that the upward trend will keep going.
Story of Investing for Medium-Term Profits
Technical Breakout Setup: The price has moved up from a long period of decline and is now settling down, which suggests that people are starting to buy more.
Risk-to-Reward Ratio: There's a small chance of losing money at the support level of 0. 012, but there's a big chance to make money, reaching between 0. 03311 and 004732
250% Target Reason: The main resistance points match up with past price patterns and show a slow return to a positive trend.
Planning When to Start and Stop:
Start buying at a price around 0. 01239 to 001262
Stop-Loss: Under 0. 01200 (a solid support area).
Profit Goals:
0. 02122 (Goal for the short term: about 75% increase)
0. 03311 (Goal for the middle of the term: about 150% increase)
0. 04732 (Goal: about 280-300% profit)
This chart setup provides:
Low risk with a clear point to stop losses.
Big chances for profit with possible returns over 250%.
A clear confirmation of a breakout and positive MACD signals are boosting confidence in continued price increases.

At the end of wave 4It is forming a corrective micro wave 3 of c. The general form of a higher view is forming a
expanding diagonally
We are finishing wave 4. The end of the correction of blue dashed lines. Wave 5 will finally end in 2 yellow boxes.
It will be updated after the start of wave 5. All in all, fasten your seat belts and enjoy the ride.

MEME/USDTThis chart presents a detailed analysis using Fibonacci levels, a potential Elliott Wave structure, and the possibility of an inverted Head and Shoulders (H&S) pattern. Based on the provided details, here’s a breakdown:
1. Fibonacci Levels:
0.236 (0.01044), 0.382 (0.01291), and 0.618 (0.01310) serve as significant support and resistance zones.
1.618 (0.02436) and 2.618 (0.03443) are marked as potential target levels. If the price continues an upward trend, these levels could act as resistance zones.
2. Elliott Wave Analysis:
A 5-wave Elliott impulsive structure seems to be completed.
If this analysis holds, the price might now enter a corrective wave or initiate another upward trend.
The (5) point is highlighted as the potential completion of the upward movement.
3. Potential Movement Scenarios:
Bullish Scenario: The price could rise to the 0.02690 level, indicating a continuation of the upward trend from major support.
Bearish Scenario: The price may pull back toward the Fibonacci 0.618 or 0.5 levels (e.g., around 0.01310), suggesting a corrective phase.
4. Chart Patterns:
Inverted Head and Shoulders (H&S): The curved structure shown suggests a potential bullish reversal if the pattern completes.
The "?" mark indicates a decision zone where the price is likely determining its next direction.
Summary and Evaluation:
Support Levels: 0.01310 (Fibonacci 0.618), 0.01044 (Fibonacci 0.236).
Resistance Levels: 0.01813, 0.02436, 0.03443.
The price is currently at a critical zone and may react to these levels before choosing its direction.
Based on this analysis, it's essential to monitor whether the resistances break or supports are retested. Additionally, always use stop-loss orders to manage risk effectively, aligning with your trading strategy. 😊

MEME Coins on the Move!
If CRYPTOCAP:BTC behaves and doesn’t mess up the party 🎉, MEME coins could shine bright!
🔥 Sitting on a strong support, they’re looking solid for long positions.
But remember, the crypto market loves surprises – stay sharp and manage your risk!
💡 What’s your top MEME coin pick right now? Let’s talk strategy!

MEME — The Undervalued Leader You Need to Watch!🌟 Are Memecoins Ready for a New Surge? 🌟
💎 MEME — The Undervalued Leader You Need to Watch!
🚀 Memecoin (MEME) is the native token powering the innovative Memeland ecosystem, brought to life by the legendary meme platform 9GAG! This cutting-edge Web3 studio is reshaping the future of online creativity and community-driven projects.
💡 Why MEME?
Powered by a globally recognized brand
Strong utility within the Memeland ecosystem
Positioned for explosive growth in the memecoin sector
🔝 Entry Setup:
⚖️ Risk/Reward Ratio: 1/5
📊 My Strategy:
🟢 Buy Zone: $0.011 - $0.013
🎯 Take Profit Targets:
TP1: $0.016
TP2: $0.022
TP3: $0.033
🛑 Stop-Loss: $0.0091
⚠️ Important Reminder:
The cryptocurrency market is highly volatile. Always practice risk management and conduct your own research before making any investment decisions.

MEME/USDTSymmetrical Triangle:
The chart clearly shows a symmetrical triangle formation. This type of pattern typically indicates that the price is consolidating within narrowing ranges and a breakout (in either direction) is likely to occur.
Symmetrical triangles can break out either upward or downward. To determine the breakout direction, pay attention to the trading volume.
Fibonacci Levels:
Fibonacci retracement levels are marked on the chart to identify potential support and resistance zones.
Levels such as 0.786, 0.618, and 0.5 are highlighted, showing where the price might react.
Key Support and Resistance:
The lower boundary (around 0.0130) appears to act as support, while the upper boundary (around 0.0140) serves as resistance.
If the price breaks above the upper triangle boundary with volume, it could test higher resistance levels. Conversely, a breakdown below the triangle may lead to a move towards lower support zones.
Potential Scenarios:
Bullish Scenario:
If the triangle breaks upward, the target price is usually calculated as the height of the triangle added to the breakout point.
Bearish Scenario:
If the triangle breaks downward, the target price is typically the height of the triangle subtracted from the breakdown point.
Suggestions:
Watch the Volume:
An increase in volume often confirms the strength of the breakout.
Set a Stop-Loss:
Place a stop-loss near the triangle's lower or upper boundary to manage risk.
Use Additional Indicators:
Tools like RSI or MACD can provide insights into trend strength and momentum.

meme - usdt 1. Fibonacci Levels
The chart shows the use of Fibonacci retracement levels:
These levels are crucial for identifying potential support and resistance zones.
Key levels visible on the chart:
0.0140 (support level)
0.0150 (resistance level)
Currently, the price is trading around 0.01493, nearing the resistance zone. A breakout above 0.0150 could indicate bullish momentum.
2. Trendlines
The chart features a downward trendline and possibly an upward trendline:
The price seems to be testing the downward trendline.
If the price breaks and sustains above this trendline, it may signal the beginning of a bullish trend.
3. Bollinger Bands
Bollinger Bands are visible on the chart, used to measure price volatility:
The price is currently moving near the middle band.
Upper Band: Acts as a potential resistance in case of an upward move.
Lower Band: Provides support during downward movement.
A contraction (tightening) of Bollinger Bands often indicates an upcoming breakout in either direction.
4. Volume Analysis
The volume bars indicate the strength of market moves:
Current volume appears relatively low, suggesting a lack of strong momentum.
A high-volume breakout is crucial to confirm any significant price movement.
5. General Trend Direction
From the chart:
Short-term recovery signals are visible, but the overall trend appears bearish.
For an upward confirmation:
The price must break and hold above 0.0150.
Failure to do so may result in a pullback to the 0.0140 support zone.
6. Recommendations
For short-term trades:
Watch for resistance around 0.0150—this could be a key selling point.
Buying opportunities might emerge near the 0.0140 support zone.
For long-term positions:
Wait for a confirmed trend reversal and higher volumes before entering.
A breakout of the downtrend and sustained trading above resistance levels is essential.

memeI think you can check the green box for buying and if there is support in the green box, it can grow to the red box.

MEME/USDT FİNALFibonacci Levels:
The chart uses Fibonacci retracement and extension levels (e.g., 0.236, 0.382, 0.5, 0.618, and 3.618).
The price is currently below the 0.786 retracement level, which has acted as strong resistance. A failure to break this level may signal a pullback or continuation of a downtrend.
Resistance Zones:
There are clearly marked horizontal resistance zones around $0.015–$0.016.
The price attempted to break this area multiple times but was rejected, which strengthens its significance.
Bearish Pattern:
A potential rising wedge or similar corrective structure is visible.
If this pattern breaks downward, the price might revisit lower Fibonacci levels, such as 0.5 or 0.382 retracements, near $0.011 or $0.009, respectively.
Volume Insights:
Declining volume during the upward move may indicate weakening bullish momentum. If selling volume increases, it could confirm a breakdown from the cu
Support: $0.011
A break below $0.011 could send the price to $0.009 or lower.
General Outlook:
Bullish Case: If MEME/USDT manages to break above $0.016 with strong volume, it could target higher Fibonacci extensions, such as 1.618 or beyond.
Bearish Case: A rejection from the current resistance zone may lead to a significant drop, aligning with the bearish pattern.

meme/usdt 15M Yellow Areas (Resistance Zones):
These zones may represent points where the price previously rose but pulled back due to selling pressure. Such levels are generally considered resistance.
The first yellow area indicates a peak around 0.01688. This could potentially serve as the "head" in a possible Head and Shoulders (H&S) pattern.
Regions Marked with Yellow Arrows:
In these areas, the price reached resistance levels and reacted. This reaction could be interpreted as the "shoulders" in a potential H&S pattern.
If the H&S pattern is valid, the price is expected to pull back to the neckline and break below it.
Neckline and Support:
The price action appears to be testing the support line (blue line) around 0.01614. If a breakdown occurs below this level, the H&S pattern may be confirmed.
The chart suggests the possibility of an H&S formation, but for the pattern to be validated:
The neckline must be clearly broken,
The breakdown should be supported by increased volume.

MEME/USDT UPDATE 04/121. Conditions for a "W" Pattern
Bottoms: A "W" pattern requires two significant lows. In this chart, the areas labeled (2) and (4) seem to fulfill this condition.
Peak: The peak between the two lows, labeled (3), forms the neckline of the pattern.
Breakout: The price must break above the neckline (around 0.01689) for the pattern to be confirmed. A breakout with strong volume is a bullish signal.
2. Fibonacci Levels
The chart includes Fibonacci retracement levels, which often act as support and resistance points.
0.786 Level (0.01689): The neckline aligns with this level. If the price breaks above this, it could confirm the pattern.
1.618 Target Level (0.01829): This is a potential target if the breakout occurs.
3. Potential Targets and Risks
If the "W" pattern is activated, the first target can be calculated as the height of the pattern (distance between the neckline and the lowest point).
However, if the price fails to break above the neckline and reverses downward, the pattern will be invalidated. In this case, support levels around 0.01575 or 0.01547 might come into play.
Conclusion
For the "W" pattern to be confirmed, the price must break clearly above the 0.01689 level with strong volume.
If this breakout occurs, the price could target 0.01829 first and potentially 0.02056 afterward.
However, entering before the breakout carries higher risk. Stop-loss levels should be carefully set, with a possible stop below 0.01575 to manage downside risks.

MEME-USDT 15MİN Symmetrical Triangle Formation:
A symmetrical triangle indicates price consolidation and a potential breakout.
If the price breaks upward, the bullish trend may continue.
A downward breakout could indicate increased selling pressure.
Support and Resistance Levels:
Resistance levels: Around 0.01874, 0.01881, and 0.01887. These levels could act as targets in case of upward movement.
Support levels: Around 0.01819 and 0.01783. These levels may act as safety nets during downward movements.
Indicators and Current Trend:
The price has increased by +9.47%, indicating positive momentum.
Volume is relatively low (2.51B), so confirmation of a breakout will require an increase in trading volume.
Recommendations:
Watch the breakout direction: Breakouts from symmetrical triangles are often accompanied by a surge in volume.
Use Stop-Loss: If you're planning to open a position, set your stop-loss below the support levels to minimize risks.
Monitor Volume and News: Keep an eye on trading volume and any related market news before making a decision.
HODLE BASKEThello friends
This coin gave a buy signal and we informed you.
After defeating your resistance, it's a good situation...
We have specified the entry steps for you and don't forget capital management.
Be successful and profitable.

MEME ANALYSIS#MEME Analysis : Channel Following
📊As we can see that #MEME is following ascending channel on daily time frame. Currently the price is trading above its major support zone. Price is moving upwards within a long-term rising channel, recently moving towards its support from its support level. Expect a bullish move in few days.📈
🔖 Current Price: $0.01650
⏳ Target Price: $0.01824
⁉️ What to do?
- Keep your eyes on the chart, observe trading volume and stay accustom to market moves.🚀💸
#MEME #Cryptocurrency #ChartPattern #DYOR

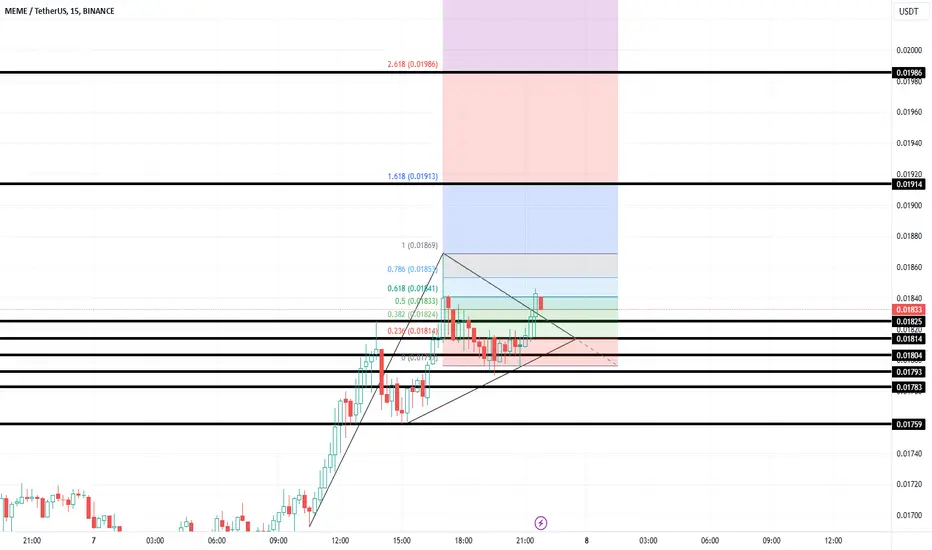
Meme USDT UPDATE 1. Trend Analysis
The price is moving within an upward channel (bounded by blue trend lines).
However, recent candlesticks are close to the lower boundary of the channel, indicating either a potential breakout downward or a bounce from support.
Observation:
If the price stays within the channel, it could continue its upward trajectory.
If it breaks below the channel’s lower boundary (around 0.01800), a downward trend may begin.
2. Fibonacci Levels
Fibonacci retracement levels are clearly marked on the chart:
The price is near the 0.618 (0.01840) level, which is a significant support/resistance zone.
The 0.786 (0.01853) level is acting as resistance above the price.
On the upside, the 1.618 and 2.618 extensions (0.01869 and 0.01930) are potential targets.
Observation:
If the price holds above 0.618, it may aim for 0.786 and higher levels.
A failure to hold this level could lead to a pullback toward 0.5 (0.01827) or 0.382 (0.01813).
3. Support and Resistance Levels
The chart has several key horizontal support and resistance levels marked with red lines:
Support Levels:
0.01810: Immediate support, with the price slightly above it.
0.01800: A psychological support level, aligning with the channel’s lower boundary.
0.01782 and 0.01758: Deeper support zones.
Resistance Levels:
0.01840: Aligns with the Fibonacci 0.618 retracement.
0.01865 - 0.01870: A stronger resistance area above.
Observation:
The 0.01800 level is critical support. If the price drops below this, bearish momentum may strengthen.
To resume upward movement, the price must first break 0.01840 and later 0.01870.
4. Channel Analysis
The price is trading within an upward parallel channel:
Lower boundary: Currently being tested around 0.01800. A bounce from this level could drive the price toward the channel’s midline (0.01850) and upper boundary (0.01870).
Breakdown: If the price breaks below the channel, it could target 0.01780 and lower.
Observation:
Staying inside the channel suggests the continuation of an uptrend.
Testing the lower boundary puts the price in a risky zone.
5. Potential Patterns
While no clear pattern is immediately visible, the following scenarios can be considered:
Channel Movement: If the price remains inside the channel, upward movement is expected.
Fibonacci Reactions: Strong bounces from the 0.618 or 0.786 levels could confirm a bullish continuation.
6. Overall Strategy Suggestions
Short-Term Trades:
Watch for a bounce around 0.01810 or 0.01800. A strong upward reaction could lead to a short-term long trade targeting 0.01840 or higher.
If the price breaks below 0.01800, consider short positions targeting 0.01780.
Long-Term Trades:
A break above 0.01865 could open the door to 0.01930 and beyond.
However, if the price falls below 0.01780, avoid long positions as bearish momentum may dominate.
Risk Management:
Place a stop-loss around 0.01780.
Take-profit levels: 0.01840, 0.01865, and higher at 0.01930.
Final Note:
The price is at a critical juncture, testing both the Fibonacci 0.618 level and the channel’s lower boundary. A breakout or a strong bounce will dictate the next major move. If you need additional insights, like incorporating technical indicators (RSI, MACD, etc.), let me know!

MEME Ready for PUMP ? "MEME" is ready for very good PUMP with the breakout of the triangle backed by the powerful trendline.
There is a great resistance on the way that is being defeated.
Don't miss this position
Upcoming targets: 0.02022 - 0.02506 for the short term
Again, it is remembered that all trades that are opened are your responsibility
Don't forget to follow.

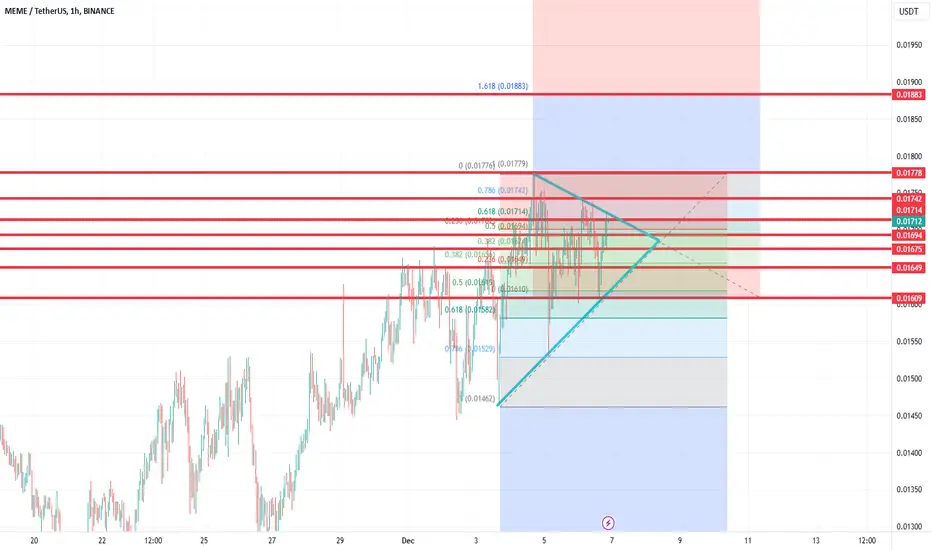
meme/usdt updateChart Analysis:
The chart shows the MEME/USDT pair and presents a price analysis on an hourly timeframe.
Fibonacci retracement levels have been applied, marking key resistance/support levels:
Important levels: 0.382 (0.0165), 0.5 (0.0161), 0.618 (0.0174), etc.
The blue lines indicate a triangle pattern in which the price is consolidating. This typically suggests a breakout is imminent.
The 1.618 level (0.01883) is marked as a potential future target.
Trend and Performance:
At the bottom-right corner, performance percentages are visible: the price has shown a +2.7% increase.
The trading volume (1.07B) is slightly below average, suggesting that the market hasn’t made a significant move yet.
Visual Details:
The desktop features a wolf image, creating a striking aesthetic focus.
On the left, trading platforms and browsers are visible, suggesting active involvement in crypto trading.