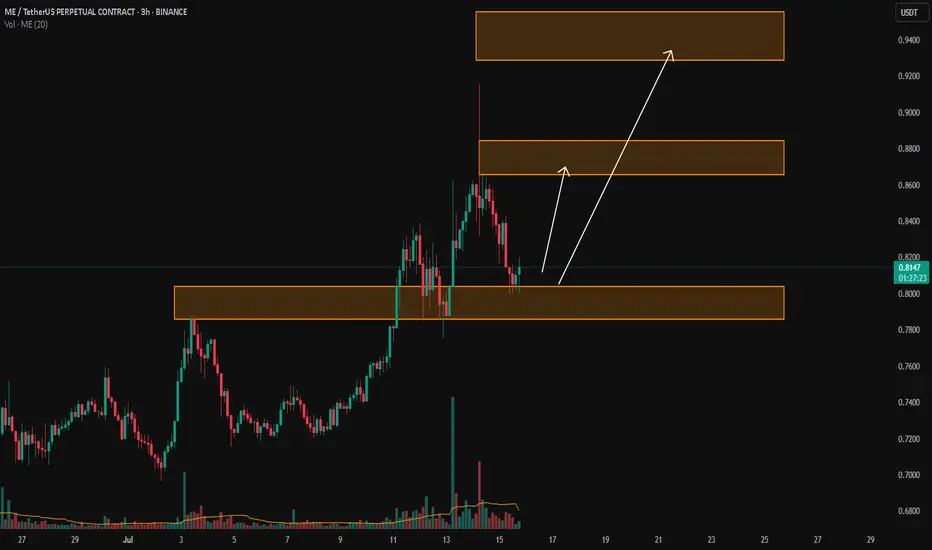
ME/USDTKey Level Zone: 0.7860 - 0.8040
LMT v2.0 detected.
The setup looks promising—price previously trended upward with rising volume and momentum, then retested this zone cleanly. This presents an excellent reward-to-risk opportunity if momentum continues to align.
Introducing LMT (Levels & Momentum Trading)
- Over the past 3 years, I’ve refined my approach to focus more sharply on the single most important element in any trade: the KEY LEVEL.
- While HMT (High Momentum Trading) served me well—combining trend, momentum, volume, and structure across multiple timeframes—I realized that consistently identifying and respecting these critical price zones is what truly separates good trades from great ones.
- That insight led to the evolution of HMT into LMT – Levels & Momentum Trading.
Why the Change? (From HMT to LMT)
Switching from High Momentum Trading (HMT) to Levels & Momentum Trading (LMT) improves precision, risk control, and confidence by:
- Clearer Entries & Stops: Defined key levels make it easier to plan entries, stop-losses, and position sizing—no more guesswork.
- Better Signal Quality: Momentum is now always checked against a support or resistance zone—if it aligns, it's a stronger setup.
- Improved Reward-to-Risk: All trades are anchored to key levels, making it easier to calculate and manage risk effectively.
- Stronger Confidence: With clear invalidation points beyond key levels, it's easier to trust the plan and stay disciplined—even in tough markets.
Whenever I share a signal, it’s because:
- A high‐probability key level has been identified on a higher timeframe.
- Lower‐timeframe momentum, market structure and volume suggest continuation or reversal is imminent.
- The reward‐to‐risk (based on that key level) meets my criteria for a disciplined entry.
***Please note that conducting a comprehensive analysis on a single timeframe chart can be quite challenging and sometimes confusing. I appreciate your understanding of the effort involved.
Important Note: The Role of Key Levels
- Holding a key level zone: If price respects the key level zone, momentum often carries the trend in the expected direction. That’s when we look to enter, with stop-loss placed just beyond the zone with some buffer.
- Breaking a key level zone: A definitive break signals a potential stop‐out for trend traders. For reversal traders, it’s a cue to consider switching direction—price often retests broken zones as new support or resistance.
My Trading Rules (Unchanged)
Risk Management
- Maximum risk per trade: 2.5%
- Leverage: 5x
Exit Strategy / Profit Taking
- Sell at least 70% on the 3rd wave up (LTF Wave 5).
- Typically sell 50% during a high‐volume spike.
- Move stop‐loss to breakeven once the trade achieves a 1.5:1 R:R.
- Exit at breakeven if momentum fades or divergence appears.
The market is highly dynamic and constantly changing. LMT signals and target profit (TP) levels are based on the current price and movement, but market conditions can shift instantly, so it is crucial to remain adaptable and follow the market's movement.
If you find this signal/analysis meaningful, kindly like and share it.
Thank you for your support~
Sharing this with love!
From HMT to LMT: A Brief Version History
HM Signal :
Date: 17/08/2023
- Early concept identifying high momentum pullbacks within strong uptrends
- Triggered after a prior wave up with rising volume and momentum
- Focused on healthy retracements into support for optimal reward-to-risk setups
HMT v1.0:
Date: 18/10/2024
- Initial release of the High Momentum Trading framework
- Combined multi-timeframe trend, volume, and momentum analysis.
- Focused on identifying strong trending moves high momentum
HMT v2.0:
Date: 17/12/2024
- Major update to the Momentum indicator
- Reduced false signals from inaccurate momentum detection
- New screener with improved accuracy and fewer signals
HMT v3.0:
Date: 23/12/2024
- Added liquidity factor to enhance trend continuation
- Improved potential for momentum-based plays
- Increased winning probability by reducing entries during peaks
HMT v3.1:
Date: 31/12/2024
- Enhanced entry confirmation for improved reward-to-risk ratios
HMT v4.0:
Date: 05/01/2025
- Incorporated buying and selling pressure in lower timeframes to enhance the probability of trending moves while optimizing entry timing and scaling
HMT v4.1:
Date: 06/01/2025
- Enhanced take-profit (TP) target by incorporating market structure analysis
HMT v5 :
Date: 23/01/2025
- Refined wave analysis for trending conditions
- Incorporated lower timeframe (LTF) momentum to strengthen trend reliability
- Re-aligned and re-balanced entry conditions for improved accuracy
HMT v6 :
Date : 15/02/2025
- Integrated strong accumulation activity into in-depth wave analysis
HMT v7 :
Date : 20/03/2025
- Refined wave analysis along with accumulation and market sentiment
HMT v8 :
Date : 16/04/2025
- Fully restructured strategy logic
HMT v8.1 :
Date : 18/04/2025
- Refined Take Profit (TP) logic to be more conservative for improved win consistency
LMT v1.0 :
Date : 06/06/2025
- Rebranded to emphasize key levels + momentum as the core framework
LMT v2.0
Date: 11/06/2025
- Fully restructured lower timeframe (LTF) momentum logic
- Enhanced entry timing for better precision and alignment with key levels
MEUSDT trade ideas
ME/USDT 300%!!!ME/USDT is showing signs of strength after a classic liquidity sweep below the $0.75 zone, which flushed out weak hands and provided a clean setup for a potential trend reversal. Price has now reclaimed the $0.80 level, a key support/resistance flip zone, signaling growing buyer confidence.

MEUSDT 1D AnalysisME ~ 1D Analysis
#ME This trade is very high risk
Buy gradually from here with a short term target of at least 15%+ from here.

Magic Eden’s ME Token Eyes Bounce After Trump Wallet VolatilityOn June 3, , Magic Eden ( BINANCE:MEUSDT ) announced a collaboration with a project called to launch a new" Trump Wallet "
This announcement triggered a + 35% price increase , pushing the price of ME Token to approximately $1.17 .
However, shortly afterward, members of the Trump family, including Donald Trump Jr. , denied any involvement with the wallet or the project.
This resulted in a -20% price drop due to shaken investor confidence .
-----------------------------
Let’s see how ME Token is doing on the 1-hour timeframe .
ME Token is trading in the Support zone($1.03-$0.96) near the 50_SMA(Daily) .
From the Elliott Wave theory perspective, ME Token seems to have completed the main wave 3 and is currently completing the main wave 4 .
I expect ME Token to rise to at least $1.146(+15%) .
Second Target: $1.237
Note: Stop Loss = $0.95
Please respect each other's ideas and express them politely if you agree or disagree.
Magic Eden Analyze (MEUSDT), 1-hour time frame.
Be sure to follow the updated ideas.
Do not forget to put a Stop loss for your positions (For every position you want to open).
Please follow your strategy and updates; this is just my Idea, and I will gladly see your ideas in this post.
Please do not forget the ✅' like '✅ button 🙏😊 & Share it with your friends; thanks, and Trade safe.

Me !!!The price on the daily timeframe is within a triangle, which can create some uncertainty about which direction it will move. Here, we should wait to see which side of the triangle the price breaks out from. Remember, the trend is our friend.
Best regards CobraVanguard.💚

ME Likely to Revisit 1.415 ZoneBased on the MissedPrice concept, rapid price moves often skip levels that price later revisits. The 1.415 level shows an Open Interest leap, suggesting missed positions.

MEUSDT 1D AnalysisME ~ 1D Analysis
#ME This trade is very high risk
Buy from here if you still have a Conviction on this coin with a short -term target of at least 10%+.

MetaUnit | Long Entry signal for MEU/USDT Analysis:
MLR > SMA: The MLR (blue) is above the SMA (pink), signaling a bullish trend.
MLR > BB Center: MLR exceeds the Bollinger Bands Center Line (orange), showing strong bullish momentum.
PSAR: PSAR dots (black) are below the price, reinforcing the uptrend.
No SMA 200: SMA 200 unavailable - proceed with caution.
Trade Idea:
Entry: Consider a long position at the daily close.
Stop Loss: Place SL at the current PSAR level to limit downside risk.
Follow Me: Follow me for exit or profit-taking opportunities.
Outlook: All indicators align for a bullish move. Stay alert for reversal signals or trend shifts.
Risk Warning: Not financial advice, trade at your own risk

MEUSDT: Ascending Channel - Is $1.300 the Next Stop?Fellow traders!
MEUSDT is exhibiting classic ascending channel behavior. Having tested the lower channel boundary, the price is likely to advance towards the upper channel boundary, with a potential target near $1.300.
Implement prudent risk management.
BINANCE:MEUSDT
MEUSDT Ready to Explode or Another Bull Trap?Yello, Paradisers! Are we about to witness a strong bullish reversal on MEUSDT, or is another trap being set? Let’s break it down.
💎MEUSDT has formed a well-structured ending diagonal with a clear 5-wave pattern, increasing the probability of an upcoming bullish move. Additionally, the inverse head & shoulders pattern, combined with bullish divergence, further supports a potential reversal. However, for confirmation, we need a decisive breakout and candle close above the key resistance zone to increase our odds.
💎In case of a retracement or panic selling, we are eyeing a bounce from the major support zone, where a potential double-bottom formation could play out. But to strengthen the bullish case, we need to see bullish I-CHoCH (Internal Change of Character) or a W-pattern forming on lower timeframes.
💎On the flip side, if MEUSDT breaks down and closes candle below the major support zone, it will invalidate our bullish outlook. In that scenario, waiting for stronger price action and a more favorable setup would be the best approach.
🎖Patience and strategy are key, Paradisers! Rushing into trades without confirmation is a sure way to get trapped. Play it smart, stay disciplined, and wait for high-probability setups. That’s how you win in this market!
MyCryptoParadise
iFeel the success🌴

Magic Eden: Looks Promising (1,050% Potential Revealed/Mapped) This is a short-term chart but I don't care. It is very clear that MEUSDT (Magic Eden) broke out of a major downtrend. This downtrend was active since last December 2024.
Good afternoon living Spirit, how are you feeling now?
Notice the blue lines on the chart, a falling wedge pattern.
The upper line defines the downtrend and it has been broken.
There is high volume when this trendline breaks. This puts us into bullish territory. So we don't care if the chart is young if the chart is saying that prices can grow.
What's your take?
I can sense some positive energies coming from this thing so its team must be planning something big. Will it grow? That's what I think.
The break of the downtrend also produced a classic bottom pattern.
This is drawn here as a yellow cup. The cup and orange line; it breaks below just to move back above.
That's all I have because this is a young chart but the market is one and it is all the same.
If we are bullish on Bitcoin, on EOS, on Polygon and the other Altcoins, Trump, we are bullish on Magic Eden and the rest of the market as well.
Some will move now, others will move very late.
The bull-market will develop all throughout 2025.
How to pick the ones that will move first?
Follow me. I will be sharing with you the best charts, the best Altcoins and the best pairs. Patience is key though, the market adapts live to everything we do, so a pair that is about to move can be easily delayed.
Instead of focusing on the short-term, think of the bigger picture; focus on the long-term.
For how long am I willing to wait to produce a successful trade?
Do I prefer to lose $1,000 fast, or is it better to earn $10,000 slow?
What are your targets?
What are your goals?
You can decide to turn $10,000 into $50,000.
This can help you develop a strategy with a clear goal in mind.
If you enter a pair and immediately you are wondering what is going to happen and anxiety takes over you, something is wrong. Like this, it can never work.
If you enter a pair and you can disconnect and take care of anything in your life that needs to be taken care of, this can work. This way can produce positive results.
If you are anxious after buying, it means you need more information, more education, you need to practice more before taking action.
If you are good. Go ahead. You will be blessed with all the good things in life and all that you truly deserve.
The market is here for us.
The market is here to stay.
Cryptocurrency is the future of money.
There is no going back now.
You are in the right place at the right time.
You are making great choices and for these choices you are making you will be paid.
The market will not end after 2025 nor in 2026 nor ever for as long as we live. This is a long-term development and it is a new market which means that the best is not yet seen.
Opportunities are endless.
Feel free to follow me if you enjoy the content.
We are here to win and succeed.
Namaste.

MEUSDT Falling Pattern Breakout with 200%-250% Potential GainsMEUSDT has recently broken out of its Falling Pattern, signaling the potential for a strong price rally. A Falling Pattern often sets the stage for a reversal, and with the breakout now complete, MEUSDT is poised to enter a bullish phase. The pattern, which typically consists of lower lows and lower highs, has now formed a solid foundation for the price to move upward. With good volume supporting this breakout, there’s strong market confidence in the project, and traders are anticipating a surge in price. The expected gain range for this move is substantial, with projections of 200% to 250%+, making this a highly attractive opportunity for those looking to capitalize on significant upside potential.
The breakout from the Falling Pattern is a key technical event that signals a shift in market sentiment. As the price pushes higher, the breakout confirms that the bears may have lost control, and the bulls are now taking charge. With volume continuing to support the move, it increases the likelihood that MEUSDT will maintain upward momentum. As more traders and investors take notice of this development, the price could continue to rise, potentially testing previous highs and delivering substantial returns for those who timed their entry correctly.
Investor interest in MEUSDT has been growing, and this breakout has captured the attention of many in the crypto community. The combination of a completed Falling Pattern, solid volume, and growing market sentiment creates a perfect setup for significant gains. If MEUSDT continues to follow the expected bullish trajectory, it could quickly move into a new price range, delivering impressive returns to traders who are quick to act. This could be the beginning of a strong bullish trend for MEUSDT, and those who enter at the right time could see massive profits.
As always, it's important for traders to watch key resistance levels and price action carefully. The next few price movements will determine whether MEUSDT can maintain its bullish trend and reach the expected gains. Given the current breakout and the positive technical indicators, MEUSDT presents an exciting opportunity for traders looking to profit from the next major move in the crypto space. Keeping an eye on volume and support levels will be essential to navigating this setup successfully.

MEUSDT Bullish trade ideaMEUSDT has been in an uptrend with support at 1.6500 being respected a few times. I think that as lomg as price stays above S1 price is still in a bullish price action

$ME need to break downtrendAll eyes on BMV:ME if it can break that downtrend.
ME is a big player on SOL and they are preparing to launch their DEX soon.
I would start adding from here with a target of +15$

Price Action to accumulate Magic Eden before Explosion! -14.5M BMV:ME blocked on Staking
-46k Staker Users.
-First Stake Reward will be given in 3Months. (Unclaimed tokens 17M + 70M Airdrop)
Crash is slowing down, I start my accumulation phase at 2.80$ and I will keep making fractional buys if the price stays bettwen 2.80$ to 1.90$ where I do believe it will be the very DIP of BMV:ME

Magic Eden - Double Bottom - breaking downtrendMagic Eden looks to have carved out a double bottom around the $2.30-2.40 area.
It is also in a very large falling wedge.
We appear to be breaking out from the downtrend of that falling wedge as we speak.
We need to establish support above the demand zone S/R of $3.26.
From there we would need to attack the $4.00-$5.00 area and establish it as support.
If we can do that, I could maybe see Magic Eden hitting $24.00-$30.00 for the latter part of this bull market.
Thank you, and best of luck in your trading and investing!

MEUSDT Perp IdeaAlright, here’s my setup for this trade, targeting a 1.88 R:
I’m expecting the price to reject off the orange resistance zone and head lower, continuing the bearish trend. My entry is just below that zone, with a stop loss placed slightly above the resistance to protect against any unexpected breakout. The take profit target is at the blue zone, where I anticipate the price to reach after a clean rejection.
What could go wrong? Well, if the price breaks above the resistance zone and hits my stop loss, this trade will fail. I’m also wary of a possible false breakout—you know, those annoying stop hunts where the price spikes just enough to stop you out before reversing back in your favor. Additionally, if the price consolidates without giving a strong bearish signal or bounces above the diagonal trendline, it could invalidate my setup.
Overall, I’m playing it safe with a 1.88 R risk-reward ratio, and I’ll be watching closely for any signs of a failed rejection.

MAGIC EDEN CHART ANALYSIS
Based on the provided chart, here's an analysis of the ME/USDT trading pair on Binance with a 1-hour timeframe:
Price Movement: The current price of ME/USDT is 2.673 USDT, which is down by 4.40% from the previous value. This indicates a bearish trend in the short term.
Resistance and Support Levels:
Resistance: You've marked a resistance level at approximately 2.998 USDT. The price has recently touched this level but failed to break through, suggesting strong selling pressure at this point.
Support: The support level is marked at around 2.659 USDT. The price has bounced off this level multiple times, indicating it's a significant support area.
Trend Line: There's an upward trend line drawn from the support area, which suggests that despite the recent downturn, there was an established upward trend before this drop. The trend line acts as dynamic support, and as long as the price stays above this line, the overall trend could still be considered bullish from a longer-term perspective.
Overbought (OB) Zones: There are two overbought zones marked on the chart:
One around 2.840 USDT to 2.887 USDT where the price previously peaked and then corrected.
Another around 2.900 USDT to 3.050 USDT, which is above the current resistance. This suggests that if the price were to break the resistance, it might enter overbought territory soon after.
Recent Action: The price has fallen from the resistance level and is now testing the support level. The candle at the current time (26:33) is red, indicating further selling pressure at this moment.
Potential Scenarios:
Bearish Scenario: If the price breaks below the support level of 2.659 USDT, it might indicate a stronger bearish trend, potentially leading to further declines.
Bullish Scenario: If the price holds above the support and the trend line, and especially if it manages to break above the resistance at 2.998 USDT, this could signal a continuation of the previous upward trend.
Given your location in the US, if you're looking for more localized insights or if there are recent developments in this market that might affect this analysis, please provide more details or let me know if you'd like me to search for recent news or data.
Remember, while technical analysis can provide insights, it's always important to consider broader market conditions, news, and fundamental analysis before making trading decisions.

ME/USDT Head and shoulders pattern The head has completed and the right shoulder is now starting to get formed you could consider this a nice long entry position.

me - bear flagFormed a "Bear Flag" pattern, now the price has reached support, after breaking through $3 you can short to $2.65, $2.2

ME/USDTSo here we can see a Shoulder-Head pattern that is nearly finished, expecf an 30% move ones the head is finished

ME/USDT 1H Analysis - Potential Cup & Handle Pattern in Formatio🚀🔥 ME/USDT 1H Analysis – CUP & HANDLE BREAKOUT LOADING! 🔥🚀
📈 Pattern Power:
Ladies and gentlemen, the Cup & Handle pattern is shining bright on the 1-hour chart! This is one of the most reliable bullish continuation patterns, and it looks ready to explode! 🌟
⚡ Hot Zones to Watch:
🟢 Resistance (Neckline): $3.69
Once we smash through this level, the skies open up for a run towards $4.55! 🎯
🟠 Support Zone: $3.60 - $3.63
The price is resting here while building energy for the final breakout.
🚀 Target & Projection:
When this baby breaks out, the 30% measured move suggests a flight straight to $4.55! 🎉💥
📌 Trade Setup Tips:
🔹 Breakout Confirmation: Wait for price to close above $3.69 with strong volume. 💪
🔹 Stop Loss: Just below $3.60 to manage risk.
🔹 Take Profit: $4.55 is the sweet spot! 🍒
🌟 Momentum Boost:
This setup has all the energy to ignite a rally. Keep an eye on volume spikes and RSI strength as the breakout nears.
The handle formation is the calm before the storm. Buckle up! 🎢
💬 Let’s Crush It Together:
TradingView family, this is the kind of setup that gets the adrenaline pumping! If you’re hyped for this breakout, drop a 🔥 in the comments! Let’s gooo! 💥🚀
How’s this for energy? 🔥🔥 Let me know if you need more hype! 😊
