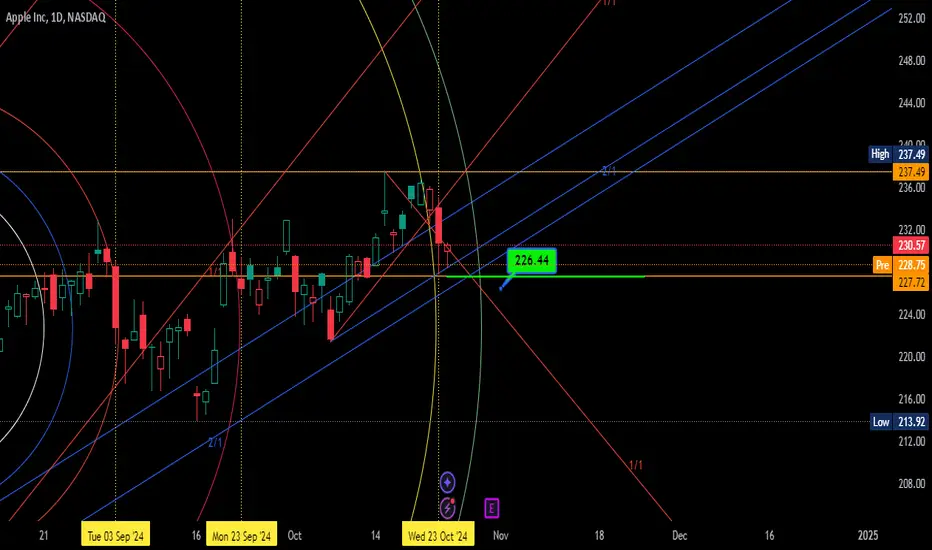
Updated Paths for AAPLAAPL is sitting on trendline support right now. It has held on every test so far so looking for it to hold again and potentially make a new ATH after. If it's a bearish break, we have some other levels below we can short on a retest. My bias would be long for now, seems like a good area to get long exposure in anticipation of a move to ATH. Pretty tight stop too.
1AAPL trade ideas


Elliott Wave View: Apple (AAPL) Looking to End Wave 5Short Term Elliott Wave View in Apple (AAPL) shows a 5 swing diagonal from 9.16.2024 low. Up from 9.16.2024 low, wave 1 ended at 233.09 and dips in wave 2 ended at 221.15. The stock resumed higher in wave 3. Up from wave 2, wave ((i)) ended at 225.97 and dips in wave ((ii)) ended at 224.22. Stock resumed higher in wave ((iii)) towards 229.75 and pullback in wave ((iv)) ended at 227.12. Final leg wave ((v)) ended at 237.49 which completed wave 3 in higher degree.
Wave 4 pullback unfolded as a double three Elliott Wave structure. Down from wave 3, wave (a) ended at 232.81 and wave (b) ended at 234.44. Wave (c) lower ended at 229.84 which completed wave ((w)). Up from there, wave (a) ended at 234.19 and wave (b) ended at 230.52. Wave (c) higher ended at 237.23 which completed wave ((x)) in higher degree. The stock turned lower in wave ((y)) with internal subdivision as a zigzag. Down from wave ((x)), wave (a) ended at 233.3 and wave (b) ended at 236.85. Wave (c) lower ended at 227.3 which completed wave ((y)) of 4 in higher degree. The stock has turned higher in wave 5. Near term, as far as pivot at 221.1 low stays intact, expect the stock to extend higher.

Buybacks vs. Dark Pool RotationThis lesson is about understanding the dynamics behind corporate buybacks. Sell-Side Institutions, aka the Banks of Record, have their floor traders do the actual buying of shares on behalf of the corporation. However, the Dark Pools, meaning the Buy-Side Institutions, start selling as the buybacks are going on.
This training will help you enter a buyback sooner and exit with higher profits for swing trading. We'll study the NASDAQ:AAPL chart to identify buyback candlestick patterns and how to see when the Dark Pools are selling to lower inventory, which is called "rotation." You will also see how the TTAccum/Dist indicator works, and how I use this excellent, leading Hybrid Indicator to aid in my analysis.

APPLAPPL price is between 4h rising channel (blue), above lower 4h trendline (green) and above lower D trendline (red). With the earning report, I expect volatility, which could potentially bring the price down to the levels of the strong support.
First one is at the lower 4h trendline, at or around 229.38, second is at the lower daily trendline at or around 223.50, the last, third is at the bottom of the 4h channel at or around 218.71.
The play: I plan to get in with 1/5 at 229.40, then buy 2/5 at 223.50 and 2/5 at 218.80. If 218.71 is broken, meaning, next day close beneath this level, that would be the sign of weakness, closing longs and, potentially, entering shorts down to 190ish level.
Hard stop for all entries is at 215.
TP could be at the top of rising 4h channel trendline which currently coincides with the psychological 240 level.

Downward channel formed!The maximum target price is around $300 for the coming 12 months. We have enough time to reach that price if everything goes well with AI and iPhone 16.
Average price target is $244.12 - again this is over next 12 months, which means it is currently too close to the average for next 12 months, indicating a price correction.
Apple seems to have formed a downward channel, plus seems to be forming Head and shoulder pattern on 30 mins chart. I expect it to fall to 228 at least before the earnings.

3 Easy Ways To Buy Apple Stock This week is a very major week because its the week
before the election season.
You may be thinking,
“Why is everyone in the stock market going crazy?”
This election season is one of the biggest indicators in the
stock market and you need to tak advantage of this
cycle.
This is because this type of cycle only happens usually once
every 4 years,
Preparing for this type of move you need a 3 step system
called the rocket booster strategy
This strategy will show you how to take advantage of this
coming election cycle.
This rocket boost strategy is the one that will show you
the 3 easy ways to buy Apple stock.If you want to use your
own easy ways then that's okay
But if you want something thats very easy to understand
and use especially during this
cycle then keep reading: ”The Secret To Buy Apple Stock Is Simply This 3 Step System”
• The Secret To Buy Apple Stock Is Simply This 3 Step System
This 3 step system is so powerful that its the one
i will be using to determine the market cycles of 2025 as well.
You are probably thinking,
“ Could this system be that easy and simple at the
same time? ”
The answer to that question is probably a yes.
So what is this system? And what exactly are the steps
for this system?
Well let me remind you that the name of this system
is called the “Rocket Booster Strategy” and it has
3 Steps:
1. The price has to be above the 50 MA
2. The price hs to be above the 200 MA
3. The price has to gap up above in a trend
This system is very important for you to understand right now
if you want to develop your own strategy thats fine as well.
But if you are looking for something simple to
understand then read the following : ”The Apple Stock That All Investors Are Talking About”
• The Apple Stock That All Investors Are Talking About
Listen apple stock is part of the specail 7 stocks that the
mainstream media is usually talking about right now.
You may be thinking,
“But why are you so focused on Apple NASDAQ:AAPL stock?”
Thats a very good question.Apple has the largest market cap in
the stock market today.Now will another company
Surpass Apple in the future?
Its very possible.This is why its going to be all over social media
am sure by now that you are reading this article you have started
to notice this already.
Honestly trading the stock is very similar to prophecy.
When i began to learn about stock trading it was not an
easy process at all.
No not at all. But it was 6 years ago.The amount of time i had
to sit on my computer learning about the financial markets was crazy.
So if you want to spend about 5 years of your life
learning and developing a new trading strategy that will work,
then you can do it.But if you are
looking for something simple which developed over
this long period of time...
then read this: ”The Lazy Man’s Way To Buy Apple Stock”
• The Lazy Man’s Way To Buy Apple Stock
It's very easy to master the first two steps of the rocket booster
strategy. Because its technical analysis. Honestly, technical
analysis feels like playing a video game.
You might be thinking,
“Is trading the stock market similar to playing a video game?”
The answer to your thoughts is yes. You see the last step of the
rocket booster strategy is based upon “Crowd Psychology”
Its the last piece of the puzzle in trading this last piece is
the last key for you to put all the pieces together.
Now are they other trading strategies out there? Yes! But you
taking the time to learn this one will help you on your
trading journey.
Your goal should be to learn, not to copy my strategy,
but to learn from it. Then you will have to go out there
and invest in more research.
So that you have knowledge to develop your strategy.
Because trading is just like a business the only difference
is its business connected to the financial markets.
Rocket boost this content to learn more.
--
Disclaimer: Trading is risky you will lose money whether you like it or not
please learn risk management and profit-taking strategies.

AAPL SHORT TRADE OUTLOOK ON EARNINGS REPORT DAY OCT.31, 2024NASDAQ:AAPL SHORT TRADE IDEA:
WEEKLY FUNDAMENTAL ANALYSIS:
>P/E Ratio (Quarterly Lookback): Apple's P/E is currently at 35.6, signaling overvaluation (typically anything above 25 is considered overvalued).
>Correlation: Both Apple's P/E ratio and value compared to Treasury bonds are flashing overvalued signals.
DAILY OUTLOOK:
>Short-term and long-term value correlations vs T-bonds and P/E ratios suggest the stock may remain overbought until the upcoming earnings report, which could act as a catalyst.
>Election Year Seasonality is strongly bearish as well.
TECHNICAL INSIGHT:
>AAPL may pull back to fill a previous price gap before slowing down.
Stay sharp, traders! 🎯 #AAPL #ShortTrade #MarketAnalysis #Investing
Disclaimer: This post is for informational and educational purposes only and should not be considered financial advice. It reflects general market fundamentals and personal speculation. Always do your own research and consult with a professional before making any financial decisions. Trade at your own risk.

Exploring Apple's Latest AI: What Does the Future Hold? Apple's recent announcement of Apple Intelligence, coupled with the launch of a new iMac, has sent ripples through the tech industry and the financial markets. While the long-term impact of these innovations on Apple's stock price remains to be seen, initial market reactions suggest a positive outlook.
Apple Intelligence: A Game-Changer?
Apple's foray into artificial intelligence (AI) with Apple Intelligence marks a significant milestone for the company. This new AI framework is designed to enhance various Apple products and services, from the iPhone to the Mac. By integrating AI capabilities into its ecosystem, Apple aims to provide a more personalized, efficient, and intuitive user experience.
Key features of Apple Intelligence include:
• Enhanced Siri: A more intelligent and capable virtual assistant.
• Advanced Image Processing: Improved photo and video editing capabilities.
• Natural Language Processing: More sophisticated text analysis and generation.
While the full potential of Apple Intelligence is yet to be realized, the initial response from analysts and investors has been cautiously optimistic. Many believe that AI could be a significant growth driver for Apple, particularly in areas such as augmented reality, virtual reality, and autonomous vehicles.
The New iMac: A Refreshing Update
The new iMac, powered by the M4 chip, represents a significant upgrade over its predecessor. With improved performance, stunning visuals, and a sleek design, the new iMac is poised to attract both consumers and professionals. However, the impact of this product launch on Apple's stock price is likely to be more modest compared to the introduction of Apple Intelligence.
Market Reaction and Future Outlook
In the immediate aftermath of the announcement, Apple's stock price experienced a modest increase. While this initial positive reaction is encouraging, it is important to note that the long-term impact of these innovations will depend on various factors, including:
• Consumer Adoption: The success of Apple Intelligence and the new iMac will ultimately depend on consumer adoption.
• Competitive Landscape: The intense competition from other tech giants, such as Google, Microsoft, and Samsung, could impact Apple's market share and profitability.
• Global Economic Conditions: Economic factors, such as interest rates, inflation, and geopolitical tensions, can influence investor sentiment and stock prices.
While Apple has a strong track record of innovation and financial performance, it is crucial to approach the company's future with a balanced perspective. While Apple Intelligence and the new iMac represent exciting developments, it is too early to predict their full impact on the company's bottom line.
In conclusion, Apple's recent announcements have generated significant buzz and positive sentiment among investors. However, the long-term trajectory of Apple's stock price will depend on a variety of factors, including the successful execution of its AI strategy and the overall health of the global economy. As Apple continues to push the boundaries of technology, investors will be closely watching to see how these innovations translate into sustainable growth and shareholder value.

Apple is at231 could bounce back from 230 and 228 to 233 and 235Apple is at 231 and it could fall and bounce back from 230 and 228 to 233 and 235 levels,
Note: This is not a buy / sell call, Trade at your own risk.

AAPL POTENTIAL UPSIDE RUNNASDAQ:AAPL - Sellers halted at a Daily Buy Liquidity Level (Major Level) with the 4h showing Potential change in 4h trend narrative due to the Broken structure to the upside. If price can break above and hold 232.20 I will look for buy opportunities througout the week as long as the 4h can continue to show healthy bullish price action fueled by market anticipation leading up to Earnings on Thursday.

AAPL Technical Analysis for Oct. 28, 2024Key Levels:
Resistance Levels:
$232.00: Recent overhead resistance; a strong breakout above this level may signal bullish momentum.
$237.23: A significant resistance level where a potential reversal may occur.
Support Levels:
$230.05 - $227.75: This area shows a cluster of recent support. A breakdown below $227 could see further downside.
$224.00 (Approx): Lower support boundary if price weakens further.
Indicators:
Volume: Elevated volume suggests active trading, but observe if there's declining volume on a pullback, which could imply consolidation.
MACD (lower panel): Shows potential bearish momentum, though it’s near the zero line, indicating a weak trend that may go either way depending on volume.
Suggested Trading Plan:
Bullish Scenario: Look for a strong breakout above $232 with volume, targeting $237 for a quick scalp. Consider a stop-loss around $230 to manage risk.
Bearish Scenario: If the price breaks down below $227 with increasing selling volume, consider entering a short position, targeting $224, with a stop around $230.
Short Disclaimer:
"This analysis is for informational purposes only and not financial advice. Always conduct your own research before making trading decisions."

Mega Cap Earnings Preview - GOOGL MSFT META AAPL AMZNWe have a big week of earnings and economic data incoming. I'm seeing a lot of good setups, but I'll want to wait until after earnings to make any big moves. There should be some great opportunities this week with everything going on, no need to gamble on high IV contracts before. Here's some charts that are most important for me to watch this week.

AAPL Apple Options Ahead of Earnings If you haven`t bought AAPL before this major breakout:
Now analyzing the options chain and the chart patterns of AAPL Apple prior to the earnings report this week,
I would consider purchasing the 232.5usd strike price Calls with
an expiration date of 2024-11-1,
for a premium of approximately $4.05.
If these options prove to be profitable prior to the earnings release, I would sell at least half of them.

Apple Calls Be careful!!!News: Apple will be reporting earnings on Thursday October 31.
Apple has a high of 237.49 that was created on Tuesday October 15, 2024. This high created has topped the previous high 237.23 created on Monday July 15, 24.
Pattern we are trading is is a ascending triangle tu the up side on the daily and 4hr time frame.
Every pull back has created a Higher Low (HL) which continues bullish momentum.
In the ascending triangle pattern, i have created two trendlines indicating support.
The dash line being the weak and the solid line being the strongest.

APPLE Under Pressure! SELL!
My dear friends,
APPLE looks like it will make a good move, and here are the details:
The market is trading on 234.99 pivot level.
Bias - Bearish
Technical Indicators: Supper Trend generates a clear short signal while Pivot Point HL is currently determining the overall Bearish trend of the market.
Goal - 229.05
Recommended Stop Loss - 238.19
About Used Indicators:
Pivot points are a great way to identify areas of support and resistance, but they work best when combined with other kinds of technical analysis
———————————
WISH YOU ALL LUCK

AAPL - LONGLots of bullish call buyers on spy, expecting this breakout to ride to the $246.84 area breakout fib. Earnings should help the push too.

APPLENever ignore double top/bottom it is taken support to 2/1 line and just below have an important support it might take reversal this is make or break level,another perspective is clearly shown time of reversal which is drawn in yellow colour,this may minor or major,
The #1 Best Stock Of October 2024 Here Is Why...This stock NASDAQ:AAPL on Thursday next week
prepare yourself with risk management strategies, and profit
taking strategies to take advantage of this opportunity
-
This gap will happen on the 31 Of October, 2024.As I am looking
at this price action, I can not help to wonder
"What if am wrong?"
You see the problem with most financial markets Journalists
they don't have experience in technical analysis like myself
and so its very difficult for most editors
To pick a side of whether to buy or sale a stock
Even before this market crash that is from happening
in Apple stock.
I was very confident in its price rise
because apple has the biggest market cap on the NASDAQ
stock exchange market.
But there is another reason why
this stock is the spotlight, its because it follows the rocket booster
strategy, which has the following 3 steps:
#1-The price has to be above the 50 EMA
#2-The price has to be above the 200 EMA
#3-The price has to gap up in a trend
Listen the gap up is market psychology...
sometimes it happens and sometimes it doesn't
But if it does then that is you signal
To let you know that you are on the right path.
Rocket boost this content to learn more.
-
Disclaimer:Trading is risky you will lose money
whether you like it or not. Please learn risk
management and profit-taking strategies.

APPLE Long From Rising Support! Buy!
Hello,Traders!
APPLE is trading in an
Uptrend along the rising
Support line and the stocks
Is now retesting it so we are
Locally bullish biased and
We will be expecting a
Further move up
Buy!
Like, comment and subscribe to help us grow!
Check out other forecasts below too!

APPLE - IndoChina has 1.387 Billion people IndoChina is where everyone has gone to manufacture. There is a huge army of workers employees by American manufacturers from Lexington Furniture (the largest in the USA that has outsourced everything to that area) sneakers, garments, and much more, and delivering excellent quality as a patter of fact.
Well all these workers have bought Iphones for themselves and their families. I expect a sizable beat. Now the technically to me look good.
Best of luck.
M

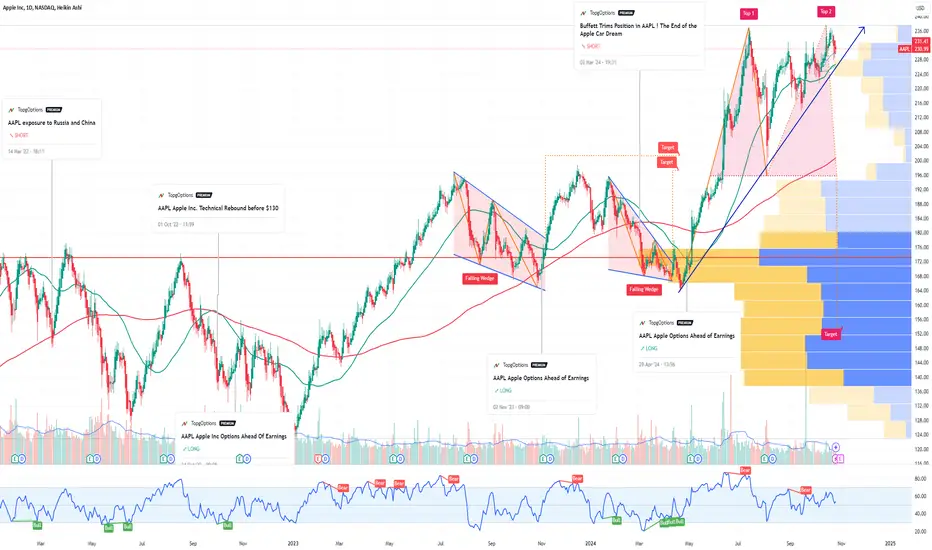
AAPL Triangle RetestSimilar to TSLA, AAPL had a nice triangle breakout and is retesting it now. Very important level IMO, we have two trendlines that should act as support along with the 225-230 area of horizontal support.
If it holds here on the retest, will most likely lead to a move back up to ATH, could long on the green arrow. If not, I'd look for these trendlines to break and retest, could short on the red arrows.
