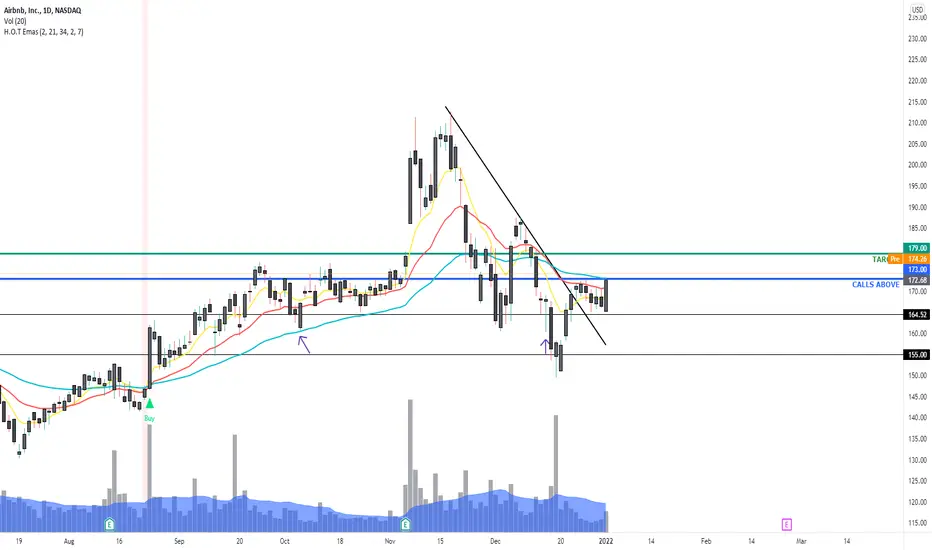
ABNB ready?Strong bullish candle yesterday (daily)
Price had already broken out of trendline, and it was consolidating.
Calls: Above PM high
Target: 180
1ABNB trade ideas
abnb breaking out, a little resistance around 175s🧐abnb broke downtrend resistance, did a retest and successfully bounced off previous resistance.
Now we are approaching strong resistance at 174.24-177.03 these would by my short term price targets.
If it breaks 177 it could hit 187.76 before we see a big pullback.
like and follow for more 💘

$ABNB Trade ideaABNB is looking for wave 2 or wave B bottom between 158-163. Both bear and bull counts point up out of that zone. Will be looking to add longs on reversal from that zone - Minimum PT 181

Airbnb ~ ABNBGreat company
Chart explains itself and I believe this one will be continued to go on discount in the following years but is one of the best stocks to pick up for the future of travel!

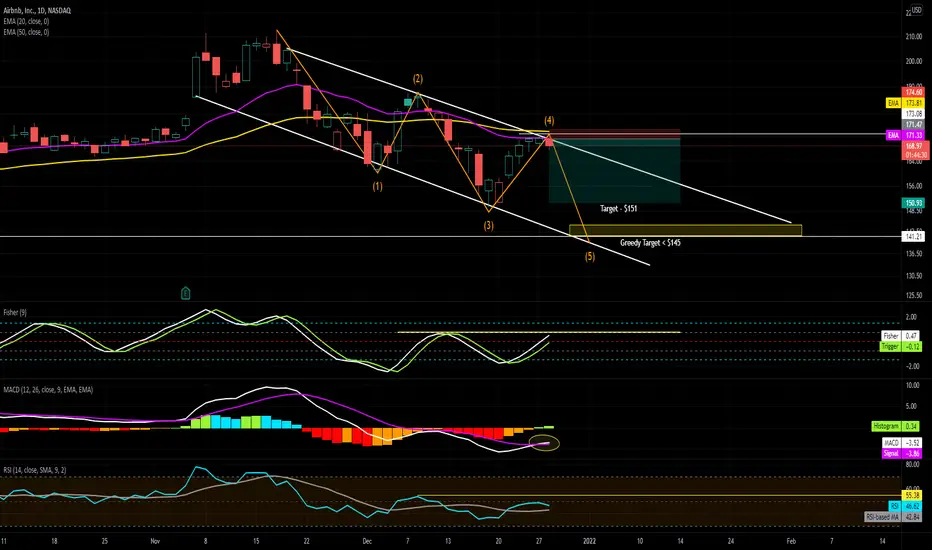
Short $ABNBLooking at ABNB, for a low risk short entry.
Stop-Loss = Daily candle close above 50EMA.
Targeting - $151 area. (sub - $142 area = Greedy Target)
Keeping an eye on Fisher Transform & RSI to stay below previous pivot highs.
Also looking at MACD for a bearish cross for confirmation.


LONG - AIRBNB (ABNB) - 1DDECISION PROCESS
Trend is degressive (logarithmic selling strength to target price level)
Strong selling exhaust (price is moving strongly with volumes)
Buying pressure (First buying signal appear on support levels) + Volume pressure but I prefer to wait two signals on two different candle (otherwise it could be already an entry).
Contradictory strength (Second buying signal (and confirmation of first one) appear with a buying volume candle)
TIPS
- If market is lateralizing and didn't took direction until the 61.8% extension of the last mouvement (red vertical dash), exit or target breakeven of the position need to be think of.
- On r/r=1 breakeven of the position need to be think of.
- Always stay aware of economic news and movement of the engulfing market (Here ES1!).
PS : Pay attention to reversal signals on yellow line, it could occured an anticipate exit.

ABNB WILL FIND SUPPORT 151 ALT 142 FOR A TRADE LONG SIDE It appears that we will find support in abnb BEAR MARKET into 151 to alt 142 . I would cover shorts now And long to buy calls for spring , market over all is acting as per forecast For wave C down . nearing the near very soon watch for my posts

ABNBWe saw nice volume last week. I am liking a retest of the channel here on the Daily. We closed right below the bottom of the channel. If we see volume, I will play it to the upside. Be aware of covid-19 related news. It may sell off on news.

AIRBNB | Still Bearish Trend; Go Short.If you find this technical analysis useful, please like & share our ideas with the community. Coming to the technical analysis of AIRBNB , I think we still going to see a downward movement. If you are going to go short, make sure to place the stop above the previous resistance area .
What do you think is more likely to happen? Please share your thoughts in comment section. And also give a thumbs up if you find this idea helpful. Any feedback & suggestions would help in further improving the analysis.
Good Luck!
Disclaimer!
This post does not provide financial advice. It is for educational purposes only! You can use the information from the post to make your own trading plan for the market. But you must do your own research and use it as the priority. Trading is risky, and it is not suitable for everyone. Only you can be responsible for your trading.

ABNB Large Base Formation We're witnessing some relatively volatile price action after ABNB reported solid Q3 earnings. I believe ABNB is a disruptive play on innovation that everyone should hold in their LT portfolio, with accelerating EPS and increasing market share within the hospitality industry.
Technically speaking, the price action for ABNB keeps returning to its broad base on the daily timeframe and bouncing every time. I like watching this base for solid entry points/DCA on my position.
Just my personal opinion, not investment advice.

Airbnb ~ ABNBABNB is one i love to watch continuously .. think it has more to come honestly. Potential double bottom here in place.

Falling Wedge- Bullish - UpdateABNB starting to catch my eye here- Big falling wedge on the hourly, 2-hour, 4-hour, and daily timeframes in addition to sitting right on its 200-Day EMA. Bullish and will be looking for a breakout from this wedge (Broader Markets Permitting) - Just some support and resistance levels along with some RSI-based supply and demand zones to keep an eye on the meantime- Previous Charts Attached Below
- Bullish Cypher formed on the hourly timeframe (See Attached Chart Below)
- Sitting right on the 200-day EMA
- EMA's converging & starting to curl upwards
- Bullish Falling Wedge
- MACD cross
- Slight bullish hidden divergence on the RSI (Not Pictured)
PT1- $173.21
PT2- $174.46
PT3- $175.11
PT4- $180.64
--ABNB Hourly--
--Previously Charted--

$ABNB holding support...This name to be added to the Nasdaq 100 around Dec 17... worth keeping an eye on as it holds support...

Airbnb is ready for a longThis stock has been beaten up lately but, it looks like it is ready to climb out of it now. It has more cash than debt which is one healthy sign for the company. Earnings was better than expected. The price ranges from $140 - $250 with ~$200 in the middle as a target. I'm thinking I'm going to aim for $198 as my first target and then to $244 for my last target. I plan to hold some for years to come also because of this being a great, innovative company.

ABNB 4H Interesting level here. If it can hold above 186.52 tomorrow, could make a run for 192.63. If not, back to 171.70.

Airbnb ~ ABNBAbnb should have continuation to the upside if it can get above 187.5
200 target would come next.
LIS 181

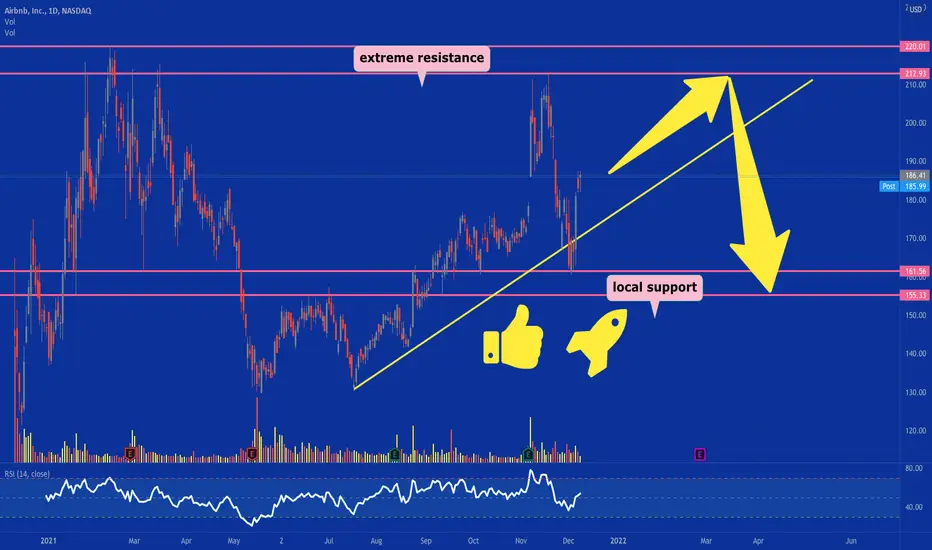
nice setup here!nice bounce off our local support zone on abnb, look for it to rally alongside the bottom trendline support, If it dips to that support thats a great risk reward entry.
I dont expect a break past all time high once we hit extreme resistance, so dont forget to secure gains once we approach that area.
goodluck! like and follow for more 💘
ABNB on the move.ABNB broke out of the ATH descending trendline.
I am waiting for a 1 hr candle to close above 186 for a swing towards 200 , 210 and ATH

retest resistance turned support for a 2nd day runnerbest risk is to enter ~177.4, yesterday's (12/6) closing VWAP & retest of recent breakout above resistance on hourly chart since Nov 22
lots of weekly call volume today, +8% today on news. other travel stocks up big today as well
since i'll be looking for it to be a 2nd day runner, my exit will be under vwap on low volume. will watch tape
plan voided if gap up in pre-market, or open below entry.
if open >182, i'll look for a quick scalp +182.1 with little risk

ABNB - WAS the OMICRON slide an overreaction?Price testing the 0.618 FIB level from the last impulse run-up.
Potential double bottom on the 1 hr is evident,
Price may go a little lower to test the Bigger picture double bottom neckline.
Retracement leg has 5 Eliotte waves evident,
Looking for price action to consolidate in the yellow box and provide an entry long trigger.
Fundamental and sentiment:
Price action may be sensitive to headlines about Omicron and general global COVID restrictions.

Airbnb (ABNB) Christmas sales!The 2021 Christmas sales continue ...
Fear of the new Omicron variant, inflation, tapering ... it seems that everything goes against the Christmas rally in this troubled 2021.
What is the reaction of a rational and cold investor? The answer is one and only one, buy, as far as I'm concerned.
I take for example Airbnb (ABNB), a company on which, whoever follows me knows, I believe blindly. I added stocks when the price hit the $ 166 level on December 1, significantly increasing the percentage in my portfolio.
Should the price continue to fall, I will accumulate again at 149.50, POC from the price of a year ago.
The mindset is always the same, to buy on important volumetric levels when the market "offers" discounts.
The time horizon is obviously important, my analyzes are always aimed at analyzing the merchant in the medium-long or very long term.
In this specific case, very long term, because I want to stay in Airbnb for a long time.
For those who are looking for a target in the short, medium term, the targets are the following:
- 175.50 first take profit
- 185 important volumetric level where sellers have taken over recently
- 210 close to the November highs
In the hope that the Omicron variant will not prove aggressive and that the vaccines continue to work, for my part I wish you a happy Sunday and we hope that the market gives us a small rally ...
Happy trading
Lazy Bull
DISCLAIMER: I am not a financial advisor nor a CPA. These posts, videos, and any other contents are for educational and entertainment purposes only. Investing of any kind involves risk. While it is possible to minimize risk, your investments are solely your responsibility. It is imperative that you conduct your own research. I am merely sharing my opinion with no guarantee of gains or losses on investments.
