AmznMost likely they push this up to 195-200 or trend line resistance here..
Hammer candle with volume at 50sma
Looks like a cup and handle to me
Stop loss below 180
1AMZN trade ideas

weekly view AMZN inverse head and shoulderThis pattern is not easy to see on the daily, so I added a more clear visualization of it on the weekly. H&S are rarely symmetrical and lining up perfectly. What draws me to this chart is more the bottoming stochastic, the prior high volume pump, the aggressive step in from buyers on the formation of the head. Mix this with AMZN and GOOGL being much more undervalued than the rest of the Mag 7 and you have a recipe for an explosion. Election year too.
-210$ is still my price target

Amzn inverse head and shouldersAmazon is printing a massive inverse head and shoulders on the daily chart. Daily is obviously more reliable than lower time frames. The upside projection of this lands right on a key fib level around 210$. I expect this to play out as AMZN is way more undervalued than the other Mag 7 stocks save googl. Amazon also has so many sectors and a massive monopoly style moat.
-210$ in the next quarter imo

AMZN: Sideways Trend & Rectangle Key Points : NASDAQ:AMZN
Sideways Trend
Rectangle Pattern.
Short Term Falling Channel is seen here.
Resistance - 189.43
Support - 173.35
If you need further analysis, please don’t hesitate to reach out. Feel free to contact me if you have any questions or concerns. If I can help in any way, please don’t hesitate to ask.

Amazon Layoff 172 Employees at The Facility Near SeattleAmazon ( NASDAQ:AMZN ) is closing a warehouse in Tukwila, Washington, just south of Seattle, following a layoff of 172 employees at the facility, known as UWA5. Amazon ( NASDAQ:AMZN ) spokesperson Sam Stephenson said employees will be offered opportunities to transfer to other nearby facilities or support if they choose not to stay with Amazon. The company is always evaluating its network to ensure it fits its business needs and improves the experience for employees, customers, partners, and drivers.
Amazon ( NASDAQ:AMZN ) employs 75,000 people in the Seattle region, many of them corporate and tech workers, as part of its workforce of 1.52 million people worldwide. Global headcount rose 4% year-over-year, as of March 31. Amazon's warehouse-related operations have driven the year-over-year growth in headcount. Last month, Amazon ( NASDAQ:AMZN ) announced new records for Prime delivery speeds in the first three months of this year, citing a shift to regional fulfilment centers. Amazon has plans to double the number of its smaller Same-Day Delivery facilities in the coming years. Last year, Amazon laid off 27,000 corporate workers, but warehouse jobs were not affected.

Amazon UpdateFor three weeks now price has been slowly grinding lower in nothing but chop. Is this the initial mini-A-wave of c? That is what it looks like to me as of now. As I have said time and time again, price can take whatever path it wants but ultimately my target boxes almost always get hit. Right now, my target box says price will eventually make it down to the $150's-$160's. I can't say for sure what path it will take or how long it will be, but I can say with confidence this appears to be a corrective pattern and one I am labeling the mini-A wave of micro c. This micro-c should complete the intermediate (A) wave of the larger wave ((2)).
Don't forget corrective patterns can chop until the cows come home and thus can take a very long time. Time wise this mini-A wave, if that is in fact what it is, has already taken longer than the initial a wave. This is partly what makes me think the mini-B wave should be starting very soon if not already. I expect that to raise to the area of the 0.236 @ $185.81 before falling again in C of c of (A) of ((2)). Plan on this larger pattern taking MONTHS to complete.

Amazon bouncing on 50EMA with 4h RSI divergence and OBV signal. - OBV signal daily
- Bouncing on the 50 EMA
- 4 hour RSI divergence.
Taking a shot here and loading more.

What is happening for AmazonHello everyone
I guess AMZN is so similar to another enormous teammates in Nasdaq markets and so it is a correction and then follow the rally.
I know that all of my predictions can be failed but it is not meaning that my work is wrong. You should consider a countertrend strategy for your analysis but as I always say" a tradre should chose his side (bull or bear) and decide about that and just time can disclose what is right and what is wrong.
It is not clear that this channel will be broken out to the lower levels or correction will finish in it and Rally continues. Whatever happens, we wait for the end of correction.
Be safe and happy

SMART MONEY NEVER LIESsimplicity of bullish stocks is that when a low if formed don't go against it. Instead let it work in your favor. more is made that way, that is one of the ways the rich get richer

AMZN Bull FlagAMZN has been in a strong up trend since bottoming with everything else in April. It did retest it's ascending channel and failed which isn't great, but now we have a nice bull flag after several weeks of consolidation.

Cup with handlethe graph is acting through like cup with handle formation. I predict if graphs finish the handle, we must see serious attack from amazon. lets see how it is being end.

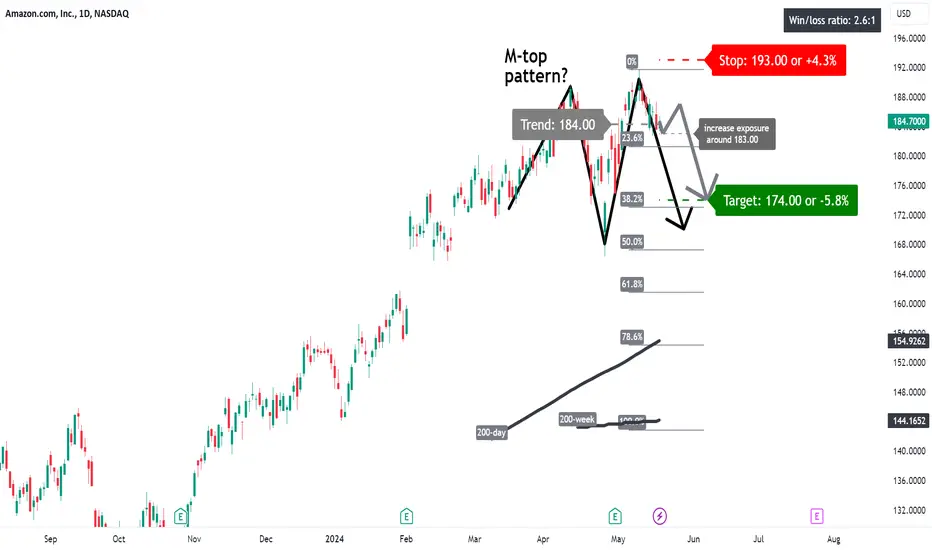
AMZN: M-top pattern?A price action below 184.00 supports a bearish trend direction.
Increase short exposure for a break below 183.00.
The target price is set at 174.00 (its 38.2% Fibonacci retracement level).
The stop-loss price is set at 193.00 (the start of the retracement).
It will appear that an M-top pattern is busy developing.
Remains a risky trade.
AMZNPair : AMAZON
Description :
Completed " 12345 " Impulsive Waves
Break of Structure
RSI - Divergence
Double Top in Short Time Frame
Fibonacci Level - 261.8%

AMZN heads up at $187.49: last strong resistance before 200This is a follow up to my $177 breakout call (click).
Nearing a significant resistance around $188.
Expecting a pullback but the market is strong.
At the least we should get some sideways action.
$ 187.49 - 188.98 is the immediate resistance of interest.
$ 197.94 - 199.63 is next major resistance and maybe top.
$ 181.95 - 182.39 is first good support that bulls must hold.
=====================================================
.

Red Flags on Amazon chartThe Amazon chart is showing several concerning signs. Although Amazon recently reached a new all-time high, this achievement wasn't supported by the daily Relative Strength Index (RSI), indicating a clear divergence on this indicator. This divergence suggests a loss of upside momentum at a critical juncture - namely around the 2021 peak at 188.65.
Additionally, on the daily chart, the market has been unable to breach the top of its daily Bollinger band. Even a retreat back to the lower end of the Bollinger band could lead to a decline towards 172, signaling a notable setback.
At the very least, it's advisable to tighten up stops on long positions.
Disclaimer:
The information posted on Trading View is for informative purposes and is not intended to constitute advice in any form, including but not limited to investment, accounting, tax, legal or regulatory advice. The information therefore has no regard to the specific investment objectives, financial situation or particular needs of any specific recipient. Opinions expressed are our current opinions as of the date appearing on Trading View only. All illustrations, forecasts or hypothetical data are for illustrative purposes only. The Society of Technical Analysts Ltd does not make representation that the information provided is appropriate for use in all jurisdictions or by all Investors or other potential Investors. Parties are therefore responsible for compliance with applicable local laws and regulations. The Society of Technical Analysts will not be held liable for any loss or damage resulting directly or indirectly from the use of any information on this site.


AMZN - Day trading, Head & Shoulder pattern, bearing formationAMZN - Day trading, Head & Shoulder pattern, bearing formation for target 183

Amazon boosts investment in Singapore's cloud infrastructureAmazon Web Services (AWS) has announced a robust investment plan, committing 12bn SGD (approximately 8.88bn USD) over the next four years to bolster the cloud infrastructure in Singapore. This initiative marks a significant move by Amazon to solidify its presence in Southeast Asia, a region renowned for its rapidly expanding economies and tech-savvy population of 670 million. This investment underscores the strategic importance of Southeast Asia as a pivotal battleground for tech giants vying for market dominance.
The region's allure for tech corporations extends beyond its large population. It features dynamic economic growth and a business-friendly climate. Analysts anticipate fierce competition among providers of artificial intelligence services, with success likely to hinge on innovation, pricing strategies, and adherence to local regulations.
Analysing the investment implications, let's review the technical analysis for Amazon.com Inc. (NASDAQ: AMZN):
In the Daily (D1) timeframe, the stock has identified resistance at 189.95 USD and support at 176.55 USD. Following a recent correction, the stock has resumed its upward trajectory, indicating potential for reaching new historical highs. Should this trend reverse, the stock could retreat to a lower target of 165.00 USD.
For traders, a continuation of the uptrend with a breakthrough above the resistance level at 189.95 USD offers a potential buying opportunity, with a short-term price target of 200.00 USD. From a medium-term perspective, the price could ascend to 215.00 USD if the upward momentum is sustained.
—
Ideas and other content presented on this page should not be considered as guidance for trading or an investment advice. RoboMarkets bears no responsibility for trading results based on trading opinions described in these analytical reviews.
The material presented and the information contained herein is for information purposes only and in no way should be considered as the provision of investment advice for the purposes of Investment Firms Law L. 87(I)/2017 of the Republic of Cyprus or any other form of personal advice or recommendation, which relates to certain types of transactions with certain types of financial instruments.
Risk Warning: CFDs are complex instruments and come with a high risk of losing money rapidly due to leverage. 69.88% of retail investor accounts lose money when trading CFDs with this provider. You should consider whether you understand how CFDs work and whether you can afford to take the high risk of losing your money.

Looking for a nice swing call on amazon soon! 🔉Sound on!🔉
Thank you as always for watching my videos. I hope that you learned something very educational! Please feel free to like, share, and comment on this post. Remember only risk what you are willing to lose. Trading is very risky but it can change your life!

AMZN Short: Potential Ending Diagonal on Price-Volume DivergenceThis is a short call that I had forced the last wave up to be an "ending diagonal". The reason for doing so is because of the price-volume divergence that is shown on the daily timeframe when AMZN was making a new high.
For those who are familiar with "Ending Diagonal", the imperfection will to be pointed out is"
"Wave 1" did not show clear 3 waves.
"Wave 2" is irregular.
As I admitted on the first paragraph, I did FORCE this count to show a possibility. Thus the stop loss is very tight: just above the high. The first take profit target will be where the wave 4 of a higher degree ends.


Amazon Set to Launch Dedicated Online Store in Ireland in 2025Amazon ( NASDAQ:AMZN ) has announced its intention to launch a dedicated online store in Ireland in 2025. This move, according to the company, will provide Irish customers with a wide selection of great value products with fast delivery, while also offering opportunities for small- and medium-sized Irish businesses to reach a bigger audience at home and abroad. Amazon.ie will offer more products from Irish businesses, low, local prices, and no additional customs charges.
The new store will provide an enhanced experience for both new and existing customers by delivering a localized shopping experience to those who already shop on Amazon stores in other countries. Furthermore, the company stated that more than 1,000 Irish businesses already sell on Amazon and generated over 150 million euros (about $162 million) in export sales in 2022.
Amazon ( NASDAQ:AMZN ) currently employs 6,500 people in Ireland, including data engineers, operations management, finance, and other roles. The company has also invested more than 17 billion euros (about $18 billion) in the country since 2020 and launched its first fulfillment center in 2022. Additionally, Amazon signed a five-year agreement with An Post in 2023 that will make deliveries and returns faster and easier.
In a related announcement, Amazon ( NASDAQ:AMZN ) stated that it is heading into its 25th year of offering Amazon Marketplace, its online experience that offers goods from independent sellers, many of which are small- to medium-sized businesses (SMBs). Launched in 2000, Amazon Marketplace has enabled independent sellers to employ more than 1.8 million people in the United States and has contributed to these sellers now accounting for more than 60% of sales in Amazon's stores.
Technical Outlook
Amazon Inc. ( NASDAQ:AMZN ) stock is up 1.09% trading on its 5th wave on the Bullish Divergence pattern. Since December 2023 Amazon ( NASDAQ:AMZN ) stock has started a Bullish divergence pattern going through 6 months now. Hence, traders ought to be cautious of a Bearish Reversal looming ahead.
