Bears To Feast On CaterpillarOn April 13, 2017, Caterpillar ( CAT ) crossed below its 50 and 100 day moving averages (DMA). Historically the stock has crossed below the 50 DMA 444 times, the 100 DMA 348 times and both have occurred on the same day 72 times. For all of these instances, the stock does not always drop over the following 11 trading days. The 50 DMA cross has a median loss of 3.627% and a maximum loss of 33.865% while the 100 DMA cross has a median loss of 2.829% and a maximum loss of 21.035%. When both crosses occur on the same day, the median loss is 2.528% and maximum loss is 19.584%.
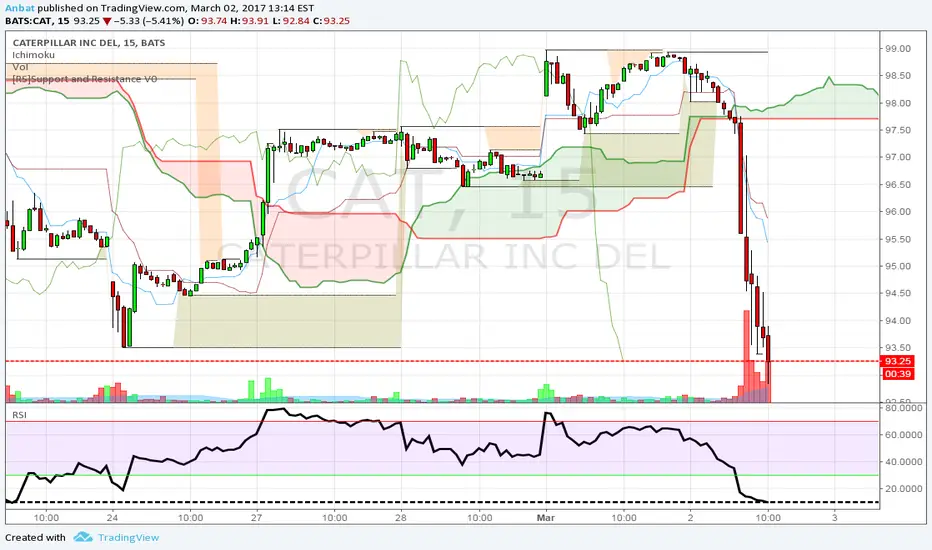
When we take a look at other technical indicators, the relative strength index (RSI) is at 45.6290. RSI tends to determine trends, overbought and oversold levels as well as likelihood of price swings. I personally use anything above 75 as overbought and anything under 25 as oversold. The current reading declares the stock is relatively neutral, but has been heading down.
The true strength index (TSI) is currently -0.9828. The TSI determines overbought/oversold levels and/or current trend. I solely use this as an indicator of trend as overbought and oversold levels vary. The TSI is double smoothed in its calculation and is a great indicator of upward and downward movement. The current reading declares the stock is moving up.
The positive vortex indicator (VI) is at 0.9853 while the negative is at 0.8779. When the positive level is higher than 1 and higher than the negative indicator, the overall price action is moving upward. When the negative level is higher than 1 and higher than the positive indicator, the overall price action is moving downward. The current reading declares the stock is drifting down with both indicators remaining below 1.
The stochastic oscillator K value is 66.0377 and D value is 77.5211. This is a cyclical oscillator that is highly accurate and can be used to identify overbought/oversold levels as well as pending reversals and short-term activity. I personally use anything above 80 as overbought and below 20 as oversold. When the K value is higher than the D value, the price action is trending up. When the D value is higher that the K value, price action is trending down. The current reading declares the stock is exiting overbought territory. This indicates the stock will begin to fall soon.
Considering the moving average crossover, RSI, TSI, VI and stochastic levels, the overall direction appears to continue heading down. Based on historical movement compared to current levels and the current position, the stock could drop another 2.25% over the next 11 trading days.
The most recent same day crosses outside of the current trend channel were in November 2013, September 2013, October 2013, December 2013, and September 2014. The respective losses were 2.526%, 2.530%, 0.624%, 0.823%, and 6.123%.
FUNDAMENTAL TAKE: Another consideration with CAT earnings approaching is our current economic state. After the election, CAT surged on hope of construction jobs in the near-term due to projected presidential policies. The construction and policies are yet to fully take shape and the price of the stock could not only appear too high, but not much has changed regarding the earnings of the company. With the stock being propped up with nothing to justify it, earnings day could be a major wakeup call for investors which could easily be the catalyst for this stock to drop to 91 or even sub-90.
1CAT trade ideas


Cat long or short Cat is another i have been watching trading around its 52 week high view was bullish with targets above $100 but we have seen some negative volumes with on going investigations into accounting issues which has seen us pullback below its 50, 100 and 200 dma's also cat has announced its closure of its Aurora plant in Illinois which could cost 800 jobs so will see how the market responds to that.
With some negatives and positives i have two points of interest
long above its dma's from 96 target around 106
short below support 89 target around 80


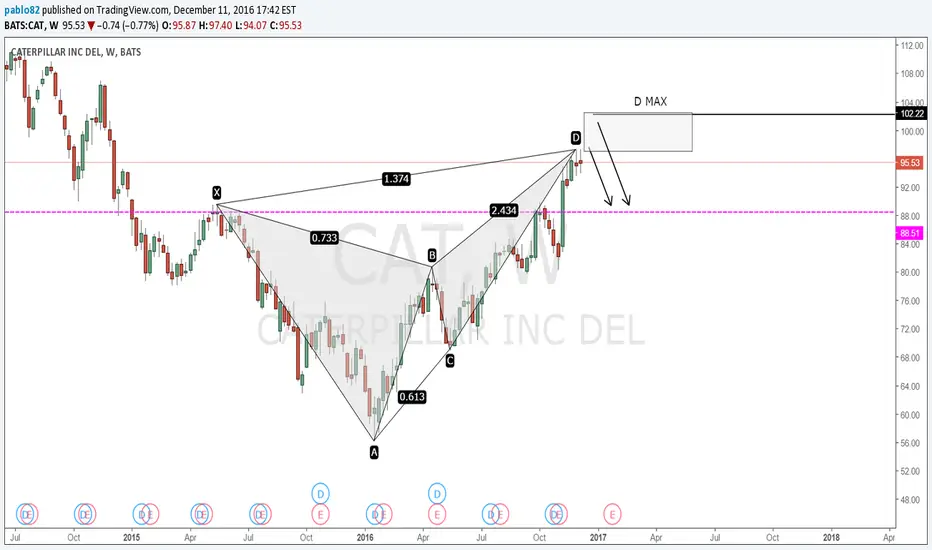
Caterpillar Inc longCaterpillar Inc has been one of the best performance since the Trump ellection. It's obvious that if you are planing to build a huge wall across the southern border, you are going to need a ton of machinery.
This month, the stock took a dive due to some accounting issues. after a few weeks of testing the support, the stocks seems ready for a new bullish ride. We expect that the stock tests once again the alltime highs arround $99.


Nice test of Low of Congestion in nice long trendThis is a longer term opportunity. The price can go still a bit down (86-88) and still be valid, if the move will NOT be quick - e.g. strong breakout.
For more ideas look at the screen.


CAT- Stay Away Rest Of WeekOn News, several authorities (FBI + others) have today have been searching their head quarters. It could be something or nothing. When a big company is RAIDED, you need to protect your money.
CAT has been a good block builder This CAT has been a good block builder recently. The Trump team is going to need it.


CAT swinging long till 100Nice breakout from the wedge that others have also been trading off. Market sentiment and up channel have my longterm outlook very bullish. Would have been nice to see some more volume but it back tested as support and bounced off the pivot at 95. Weekly chart confirms this should be a nice breakout ahead of earnings next week. Getting in now as a gap up is a big possibility as the new administration releases their infrastructure plans.

Bearish Wedge Signals Drop On $CAT To $84.75There is a classic bear wedge development on the stock chart of Caterpillar Inc. (NYSE:CAT). Upon breaking the support line of $92.50, Caterpillar will fall quickly to $84.75. You can see the wedge in the stock chart below. The target level of $84.75 is a gap fill. This will be a major support and probably a solid buy level. Stay tuned and opt-into my live trades to get my exact entries, stops and targets. Opting into my trades is free, you only reward me with a few Dollars IF I give you big winning trade information. Verified Investing is the future.


CAT @ daily @ best dow share (+42%) 2016, still pretty bullish ?Take care
& analyzed it again
- it`s always your decision ...
(for a bigger picture zoom the chart)
This is only a trading capability - no recommendation !!!
Buying/Selling or even only watching is always your own responsibility ...
DOW JONES Index incl. all 30 Shares (2016 Yearly Performance) @ drive.google.com
Best regards
Aaron

CAT kills a Bear - What happend...Initiated this BCS bevor price broke back in the fork again (hint hint hint ;-) )
This is me, being impatient (proof: I'm human).
Because this is a risk defined trade, I leave it on with "hopium" that price come back again, below my strike of 90 (...LOL...good one Dude...).
Meanwhile I sell some puts to reduce some of my loss.
Next...
P!


Caterpillar Got SoldCAT has just completed a rising wedge pattern last week and now awaiting breakout.
Cheers!
