CROXUptrend
although market is not so bullish but this char has shown that its gonna get 184 so i suppose it can be good buying opportunity by setting SL in a sure level.
1CROX trade ideas

Crocs May Be Set for Continuation HigherCrocs has been running since last summer. Now after a three-month pause, the footwear stock may be poised for upside continuation.
The first pattern on today’s chart is the bullish price gap after earnings beat estimates on February 16. CROX tried to rally but falling MACD dragged prices lower at the time. The oscillator proceeded to stabilize and turned higher in late March. Could it now pull the shares higher?
Second, you have the rounded basing pattern during the consolidation phase.
Third, CROX has remained near the 50-day simple moving average (SMA). Also notice how the 21-day exponential moving average (EMA) briefly fell under the 50-day SMA but just crossed back above it. That action may suggest the trend remains bullish.
Finally, CROX formed an inside week following an outside week in late March. Such tight movement could indicate prices are preparing to move again.
TradeStation has, for decades, advanced the trading industry, providing access to stocks, options, futures and cryptocurrencies. See our Overview for more.
Important Information
TradeStation Securities, Inc., TradeStation Crypto, Inc., and TradeStation Technologies, Inc. are each wholly owned subsidiaries of TradeStation Group, Inc., all operating, and providing products and services, under the TradeStation brand and trademark. TradeStation Crypto, Inc. offers to self-directed investors and traders cryptocurrency brokerage services. It is neither licensed with the SEC or the CFTC nor is it a Member of NFA. When applying for, or purchasing, accounts, subscriptions, products, and services, it is important that you know which company you will be dealing with. Please click here for further important information explaining what this means.
This content is for informational and educational purposes only. This is not a recommendation regarding any investment or investment strategy. Any opinions expressed herein are those of the author and do not represent the views or opinions of TradeStation or any of its affiliates.
Investing involves risks. Past performance, whether actual or indicated by historical tests of strategies, is no guarantee of future performance or success. There is a possibility that you may sustain a loss equal to or greater than your entire investment regardless of which asset class you trade (equities, options, futures, or digital assets); therefore, you should not invest or risk money that you cannot afford to lose. Before trading any asset class, first read the relevant risk disclosure statements on the Important Documents page, found here: www.tradestation.com .

CROX long term short and waiting for a DT for short termCrox is amidst forming a topping formation in the pattern it is in. I think it has little gas in the tank and if the top confirms, I will look for an entry. Zoom in to see my play. Should be quick, 6:1 risk/reward. For longer term shorts, 50% retracement should be around $125, but I would imagine it could form a Bearish Head and Shoulders (the longer term path is a rough ballpark) and come crashing down by June of 2022. If it tops here, I would be short crox

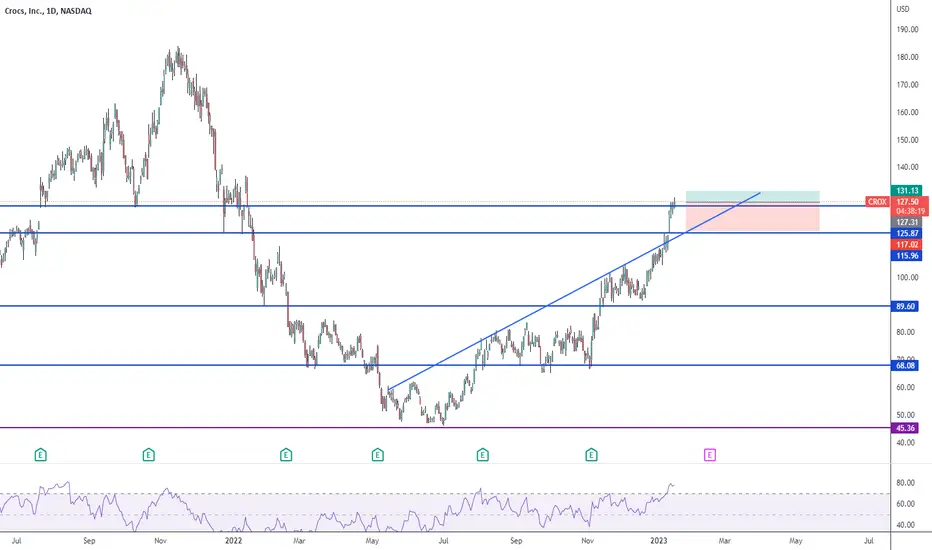
L CROX Price in clear uptrend with the major MA sloping up
Recent earnings good and came with a gapup
execution on the base formed and break up of it
SnP500 and NQ Showing sign the retracement is ending and a new up swing is in motion
Stop if close firmly below 120, or a very strong selloff Price Action
TP1: at prev swing high arnd 143.5 take 3/4 out
TP2: arnd 150 , the upper trend line , take reminder off
Is it turning back down? I see some potential bearish patterns here. Is very early to tell but if it happens is going to fall very fast like it did before. The big rejection at the $140 level tells me that the price is losing steam and it can turn around at any moment. I have a short position. I know I could take a few more days to build up, I'm waiting.

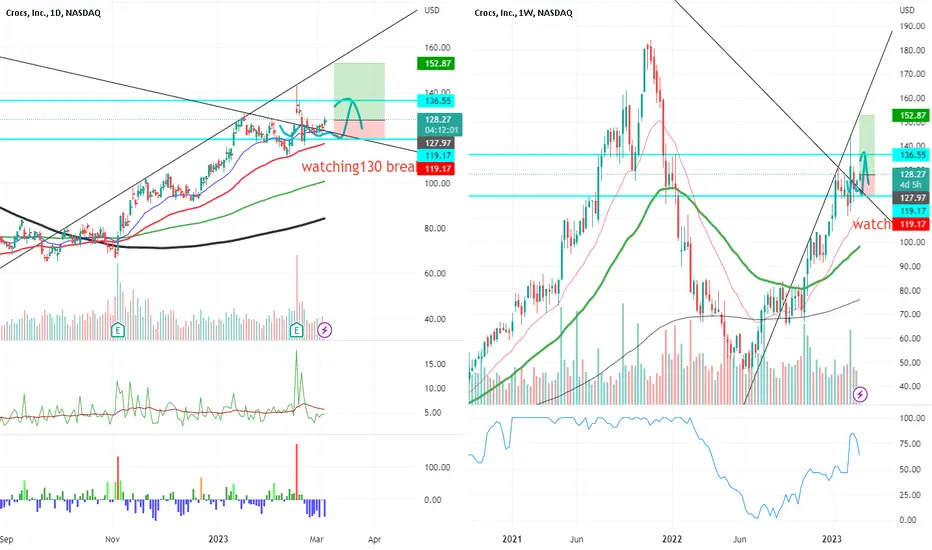
CROX bulls hold control here for now holding above trend support zone/local trend support and RSI, this is what we call nice cluster support!
good chances we bounce here and head to 130_ soon, boost and follow for more.. thanks <3

It needs a correctionIs super over extended. It can go down very fast. It just opened a short position.
CROX daily - the possibility of a bull run after a breakoutTHE CONSISTENT TRADES analyze CROX as a bullish/strong fundamental stock and therefore would be traded only in a long position.
CROX had a nice and strong move up and after extremes in RSI and MACD it cool down. The top of the leg which finished with a bearish reversal candlestick pattern Shooting star was on lower volume which indicates there is not real drop in front of us. This whole consolidation was on smaller volume which is great for bulls because it shows us there are not too many sellers.
CROX is above 20, 50, and 200 days MA which is bullish. This consolidation need to keep CROX above 20 days MA to stay bullish.
Volume is showing us for now this is only a consolidation of price not the start of a bear move.
RSI did cool down which is good for bulls.
MACD is close to the zero line and should be great for CROX to keep it above zero lines and start moving up slowly.
Overall: CROX consolidates its price on this level and is forming a small falling wedge or Bullflag which both are bullish Patterns. A break of the upper dotted trend line would be a point for entering a long position. Also if it starts to move on stronger volume would be a buy signal. The first major resistance could be at the top of the shooting star but it should pass through it if breaks occur. If the drop continues on a smaller volume and smaller candle it would still be bullish but in that case, would be triggered BullPullback pattern and a bullish one.

#CROX hate the shoe but love the chartMassive inverse head & Shoulder breakout on this chart, supported by elevated volume. Got to hate the shoes - but hard not to love this chart. Lots of upside for relatively low risk

CROX - bullish but near-term resistence overheadCROX is up 28% since breaking out from a 3 month sideway consolidation in early Nov2022. I posted about it on 6 Nov and placed a tight stop just under it's last bullish candle @ 76 and was never stopped out.
It is now forming a bullish pennant (a positive) just under a horizontal resistence zone 109 - 111 (a negative). the chance of breaking up or pulling back from here is 50-50 right now. I will take 1/3 profits and tighten the stop for the rest to just under 100 (50% fib retracement of it's most recent mini upswing).
Should the stock has a successful breakup above 111 eventually, then that will be another bullish trigger. Let's see how it goes.
Disclaimer: Just my 2 cents and not a trade advice. Kindly do your own due diligence and trade according to your own risk tolerance and don't forget that money management is important! Take care and Good Luck!

CROX Stock analysis Stock analysis – CROX
CROX has recently been included in my portfolio due to its impressive fundamental data and strong technical performance throughout the macroeconomic headwinds.
Fundamental picture
In the last 3 years CROX earnings per share (EPS) has surged 117% and sales have climbed 43%. These exciting numbers are backed up with consensus estimates being revised higher each quarter, indicating an upward trajectory. In addition, the Return on Equity value is 113% while the EBITDA margin is sitting at 28%. These values are encouraging as they show the company is very efficient at returning profit from investment in a highly competitive industry. A cautionary note should be added due to the high debt held by CROX, which could become increasingly problematic in a high interest environment. Although this requires monitoring, the high earning power of CROX should allow them to manage their debt load effectively.
Relative strength
A clear sign of an emerging group leader is strong price action in the face of a retreating broader market. The most recent downturn in the broader @Nasdaq and @S&P500 markets has not been reciprocated by CROX. In the previous month the broader markets have dropped approximately 10% while CROX has gained almost 15%. This is signal of institutional accumulation during a time of fear.
Inflection point
The fundamental picture tells you what to buy, whereas the technical picture tells you when to buy.
CROX is in a confirmed uptrend as shown by the traffic light lines in the graph. The green (50-day MA) is above the orange (100-day MA) which in turn in above the red (200-day MA). This trend is backed up by the RSI line operating in the upper half of the (purple) graph. The buy point is indicated by the recent breakout from the consolidation channel at the same time as the bullish MACD cross. This indicates the momentum has shifted from consolidation to accumulation and was the exact point my portfolio started buying.
As always, do your own research and remember that risk management is paramount.
Copy me on Etoro --> Username: JM15931 or Josquin Mills

CROX - broke out of consolidationCROX broke out of an Adam & Eve bottom on 29 Jul, however it began to trade in a wide sideway range for the next 3months. Part of the reason could be due to overall market weakness / bearishness and traders/investors were not bullish enough to want to push the stock decisively higher until they can see at least another round of earnings beat/guidance.
With the stock is now back above it's 200 day moving average and it is likley that it is on it's way to "recovery'. However I will not be too surprised that the path forward could stll be fraud with choppiness considering the overall market condition.
With the strong volume push above the consolidation range, any near term retracement could (hopefully) find support at Friday's large candle's low @76.
Disclaimer: Just my 2 cents and not a trade advice. Kindly do your own due diligence and trade according to your own risk tolerance and don't forget that money management is important! Take care and Good Luck!

CROX - uptrend still intactDespite the sharp pullback last week, CROX did not break the near term support (adam & Eve neckline), and still forming higher highs and higher lows right now.
Stronger resistance coming up around $84 so watch out here.
Disclaimer: Just my 2 cents and not a trade advice. Kindly do your own due diligence and trade according to your own risk tolerance and don't forget that money management is important! Take care and Good Luck!
CROX bull swingtradeIf I LOSE on this trade, I will buy CROX and only wear crox for a whole week, no matter what (except for my iron man week)
:-)

CROX Reversing a Triple Bottom with Earnings on the horizonand is in a brekout above an ascending parallel channel. Beat earnings in May expect the same
tomorrow and to continue the uptrend

CROCSRevenue for this quarter is projected to increase by more than 40%, but after the rapid growth, the paper should unload slightly and then continue to grow. If after the report there will be a drop - you can safely buy the shares.

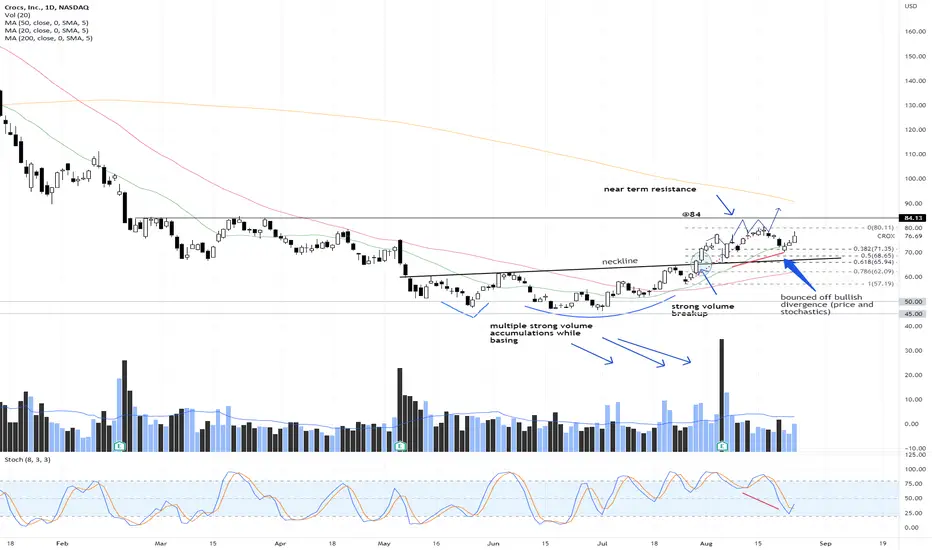
CROX - Adam & Eve breakupCROX has the potential for a bigger run as it broke out of an Adam and Eve formation with strong volume, and prior to that there were already several strong volume days (stealth accumulation!) during the base formation. Any near term pullbacks will be opportunity to long, with the neckline likely to hold as immediate support (~$65).
Could face some headwinds as it hit around $84 eventually. But after some consolidation, should it be able to break above $84 then a longer run is definitely underway.
p/s watch out for Earnings expected this Thurdday (before market opens). Any selling on "news" could be opportunity to stake if it hold above the neckline @ 65
Disclaimer: Just my 2 cents and not a trade advice. Kindly do your own due diligence and trade according to your own risk tolerance and don't forget that money management is important! Take care and Good Luck!

CROX make or break pivot area 🥶Failure to break my long trigger pivot at 64.10 will lead to more downside and test of trend resistance.
break over 64.10 and we can target 70-82-94

Short idea on CROXThe stock has been slowly retreating and has a pronounced down trend on the daily time frame. Taking that cue and the past
activity using supply zones have curated this trade to participate in the next move down.

#CROXTrading for to cheap company growing solid and just had great earnings. Fractal taken for the bottom of the 08/09 crash and run up. Updated version first time messing around with fractals.

Crocs Trading for to cheap. forward pe around 5. Fractal taken from the 08 crash/recovery. Looking for 150+ to start scaling out. 250+ probably hopeum. First time messing with fractals.

Happy Cinco De MayoEarnings 5/5
PENN
LCID
BUD
NKLA
CRCX
MELI
SQ
DDOG
RCL
SHOP
Do your own due diligence, your risk is 100% your responsibility. This is for educational and entertainment purposes only. You win some or you learn some. Consider being charitable with some of your profit to help humankind. Good luck and happy trading friends...
*3x lucky 7s of trading*
7pt Trading compass:
Price action, entry/exit
Volume average/direction
Trend, patterns, momentum
Newsworthy current events
Revenue
Earnings
Balance sheet
7 Common mistakes:
+5% portfolio trades, capital risk management
Beware of analyst's motives
Emotions & Opinions
FOMO : bad timing, the market is ruthless, be shrewd
Lack of planning & discipline
Forgetting restraint
Obdurate repetitive errors, no adaptation
7 Important tools:
Trading View app!, Brokerage UI
Accurate indicators & settings
Wide screen monitor/s
Trading log (pencil & graph paper)
Big, organized desk
Reading books, playing chess
Sorted watch-list
Checkout my indicators:
Fibonacci VIP - volume
Fibonacci MA7 - price
pi RSI - trend momentum
TTC - trend channel
AlertiT - notification
tickerTracker - MFI Oscillator
www.tradingview.com

CROX swing trade from double bottom into upcoming earnings -targets set from pivots and recent volume profile
