$CRWD with a Bearish outlook following its earnings #Stocks The PEAD projected a Bearish outlook for $CRWD after a Negative Under reaction following its earnings release placing the stock in drift D.
1CRWD trade ideas

CRWD BounceCRWD has a inclining support zone at the 173 area, with higher lows being met at this zone followed by higher highs. Thinking CRWD will bounce from here and reach a higher high around the 198 area.


CRWD-BUY strategyThis share has a lot of potential to test $ 185.00. The DARK MOON phase and GANN support and two hammer bottoms, provides a clear basis for the test of $ 185.00.
Strategy is BUY @ 171-173 and take profit @ 185.00 for now.

The Crowd Strikes BackTime to initiate order 66. Any remaining high price to sales stocks should be shorted into oblivion.

CRWD upside likely Crowdstrike holdings may embark on a mid-term upside after a diamond bottom was spotted. Furthermore, the bullish upside is confirmed by the ichimoku’s 3 bullish golden crosses after the candle has trended above the senkou-spanB and the last of kumo bullish twist has happened.
DMI shows a rising positive DM (blue) trended above 25 and with rising MACD confirm the bullish upside.

CRWD should hit $200There was a massive amount of compression on CRWD. Now as volatility increases we have bullish momentum. Fibonacci sequence shows $200 is reasonable.

CRWD another no PE money loser In a time of higher interest rates, slowing growth, layoffs in everything tech, this stock is not a knife you want to catch, looks like just another suck you in bear market rally which is to be sold, not bought!!

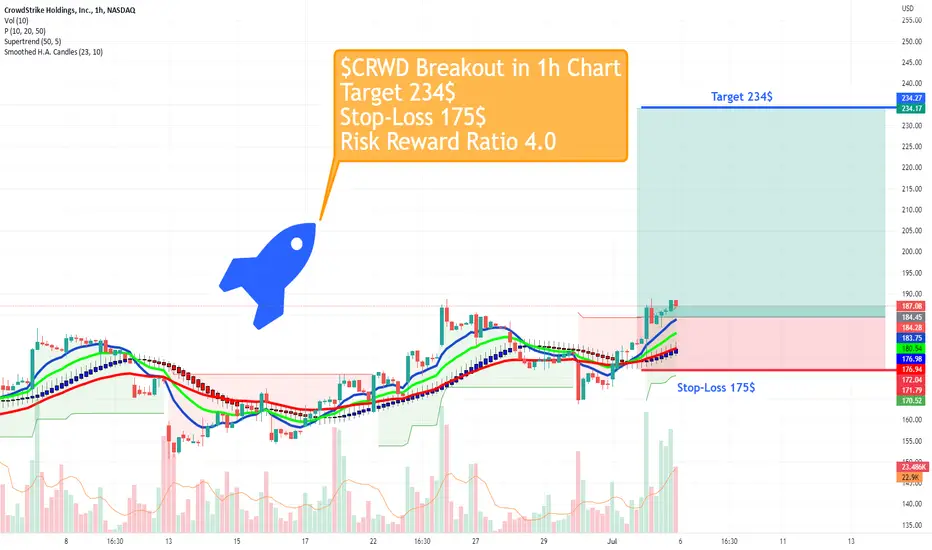
$CRWD Breakout #fintwit #supertrend#CRWD Breakout 🚀 in 1h Chart - Target 234$ 🧲
All Entry Criteria have been met:
1. Price above 10, 20 & 50 EMA ✅
2. Consolidation Phase in Uptrend ✅
3. Breakout on above average Volume ✅
4. Breakout Supertrend line ✅
Comeback of CRWD seems possible- Bearish distribution phase May 12 to May 22, 2022 resolved to the upside reclaiming $ 150, which is now support again
- one can see new higher lows and new higher highs since May 22
- Reclaim and multiple successful retests of MA 21
- Reclaim of MA50 and successful retest July 1
- Bullish engulfing July 1
- MACD histogram positive and back in positive territory
- OBV increases
- Aroon Up and Down still unstable but could confirm a new uptrend soon. Overall, that does not look bearish to me any more at all.
To me, that looks like a speculative buy already. I would definitely not short CRWD. Time to look at other tech stocks, too? Maybe the worst part is over already.

The Crowd (Strike) goes wild!CrowdStrike
Short Term
We look to Buy at 158.14 (stop at 148.77)
We look to buy dips. Prices expected to stall near trend line support. Previous support located at 156.00. We look for a temporary move higher. Expect trading to remain mixed and volatile.
Our profit targets will be 181.11 and 188.00
Resistance: 189.00 / 240.00 / 287.00
Support: 156.00 / 137.00 / 120.00
Disclaimer – Saxo Bank Group. Please be reminded – you alone are responsible for your trading – both gains and losses. There is a very high degree of risk involved in trading. The technical analysis , like any and all indicators, strategies, columns, articles and other features accessible on/though this site (including those from Signal Centre) are for informational purposes only and should not be construed as investment advice by you. Such technical analysis are believed to be obtained from sources believed to be reliable, but not warrant their respective completeness or accuracy, or warrant any results from the use of the information. Your use of the technical analysis , as would also your use of any and all mentioned indicators, strategies, columns, articles and all other features, is entirely at your own risk and it is your sole responsibility to evaluate the accuracy, completeness and usefulness (including suitability) of the information. You should assess the risk of any trade with your financial adviser and make your own independent decision(s) regarding any tradable products which may be the subject matter of the technical analysis or any of the said indicators, strategies, columns, articles and all other features.
Please also be reminded that if despite the above, any of the said technical analysis (or any of the said indicators, strategies, columns, articles and other features accessible on/through this site) is found to be advisory or a recommendation; and not merely informational in nature, the same is in any event provided with the intention of being for general circulation and availability only. As such it is not intended to and does not form part of any offer or recommendation directed at you specifically, or have any regard to the investment objectives, financial situation or needs of yourself or any other specific person. Before committing to a trade or investment therefore, please seek advice from a financial or other professional adviser regarding the suitability of the product for you and (where available) read the relevant product offer/description documents, including the risk disclosures. If you do not wish to seek such financial advice, please still exercise your mind and consider carefully whether the product is suitable for you because you alone remain responsible for your trading – both gains and losses.

$CRWD D/W$CRWD on the daily showing a big bear flag. On the weekly it looks much better. Since friday is the last day of week, a weekly break makes it much more meaningful. Full measure move target around 54

BOS + LHBreak of Structure with Lower High
Waited for pullback and brought puts on continuation
3:1 RR

CRWD - Bearish FlowCRWD broke down the chanel on 30 mins chart, under vwap and 9 ema. Bearish flows end of the day. I want to see if it brakes down below 164 for a put play. Target 160.

Bias more on downside50% Fibo may be the support turn resistance line.
If price able to close above 50% fibo next week, we may want to wait till price get nearer to 61.8% to short it down or nearer to last week high.

$CRWD - wednesday maybe for buying 176.34 is a key area
I am not willing to be too wrong here
Enter around 176.34 (heading up with volume)
Stop is 166.10 or 175.91 if you are really frugal.
Reentry would be after holding 157.65
This is for scalping.
Target for any entry is $185

CRWD High-risk Initial LongCRWD High-risk Initial Long. SL and TP on the chart. If CFD 10-20x leverage. Move SL on TP.

CRWD Ascending Scallop Repeating StructureA big Ascending Scallop structure can be identified before the recent break down
Using some price formations within this break down another scallop similar to the first can be plotted
It creates a very bullish scenario which is shown by the white bars pattern (lines pattern)
This is one of the scenarios I can see price progressing

Crowd being struck down? CrowdStrike
Short Term - We look to Sell at 156.68 (stop at 167.00)
Preferred trade is to sell into rallies. Price action is forming a bearish flag which has a bias to break to the downside. Short term oscillators are moving lower. We therefore, prefer to fade into the rally with a tight stop in anticipation of a move back lower. Our outlook is bearish.
Our profit targets will be 130.62 and 120.15
Resistance: 155.53 / 191.54 / 240.00
Support: 130.00 / 119.00 / 95.00
Disclaimer – Saxo Bank Group. Please be reminded – you alone are responsible for your trading – both gains and losses. There is a very high degree of risk involved in trading. The technical analysis, like any and all indicators, strategies, columns, articles and other features accessible on/though this site (including those from Signal Centre) are for informational purposes only and should not be construed as investment advice by you. Such technical analysis are believed to be obtained from sources believed to be reliable, but not warrant their respective completeness or accuracy, or warrant any results from the use of the information. Your use of the technical analysis, as would also your use of any and all mentioned indicators, strategies, columns, articles and all other features, is entirely at your own risk and it is your sole responsibility to evaluate the accuracy, completeness and usefulness (including suitability) of the information. You should assess the risk of any trade with your financial adviser and make your own independent decision(s) regarding any tradable products which may be the subject matter of the technical analysis or any of the said indicators, strategies, columns, articles and all other features.
Please also be reminded that if despite the above, any of the said technical analysis (or any of the said indicators, strategies, columns, articles and other features accessible on/through this site) is found to be advisory or a recommendation; and not merely informational in nature, the same is in any event provided with the intention of being for general circulation and availability only. As such it is not intended to and does not form part of any offer or recommendation directed at you specifically, or have any regard to the investment objectives, financial situation or needs of yourself or any other specific person. Before committing to a trade or investment therefore, please seek advice from a financial or other professional adviser regarding the suitability of the product for you and (where available) read the relevant product offer/description documents, including the risk disclosures. If you do not wish to seek such financial advice, please still exercise your mind and consider carefully whether the product is suitable for you because you alone remain responsible for your trading – both gains and losses.

Fibonacci retrace, Elliott wave, fundamentalsCyber security is growing jobs by 33% over the next decade (Bureau of Labor Statistics). State actors like China, Iran, North Korea, and Russia are unlikely to stop their cyber campaigns. We can see on the chart a .618 retrace of the first impulse up. Or this was the 4th wave down. Or this was an ABC retrace.
The whole economy is probably going into recession. China has defaulted companies. I hear Canada might be going into a housing crisis.
Could take some time, with more downside, but I see a $390 price eventually. Crowdstrike marketing has been great.

$CRWD bit Head and shoulders patternJust noticed big head and shoulders pattern on $CRWD. One of Tweeter darlings so no doubt it will be deemed too obvious. Just like $PTON was. If it plays out, rough times for Cybersecurity ahead.

Short the CRWD FavoriteNASDAQ:CRWD
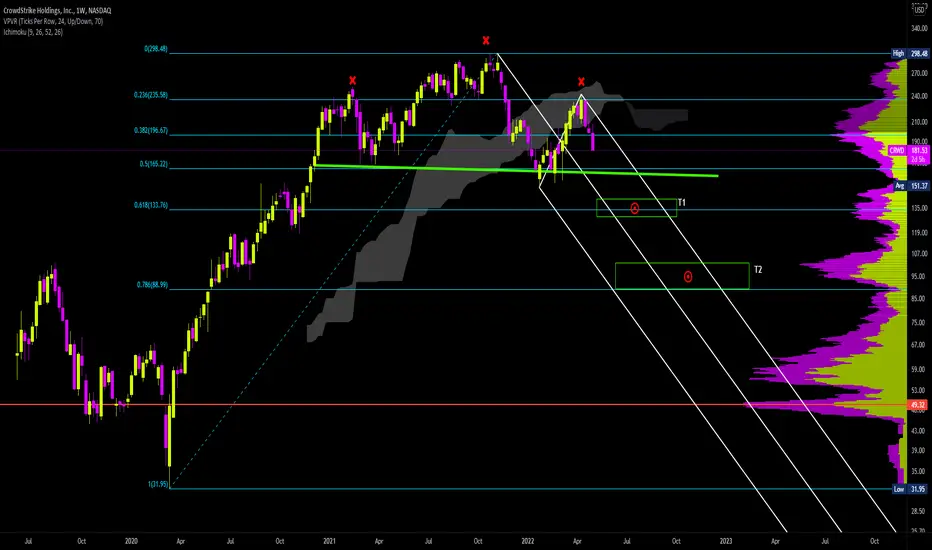
$CRWD - Crowdstrike's weekly chart appears to be completing a Head & Shoulders chart pattern.
The weekly candles have been rejected by the cloud, which is now resistance.
Although Crowdstrike has held up very well when compared to tech overall, it is still a high PE tech stock.
The current rising rate and QT environment will not favor this company.
Looking at the volume profile, it appears that meaningful support $130, $100, $60 price levels.
Based on the H&S pattern; I'm expecting price to drop to the 0.68 fib or $130 level (Target 1)
However, due to the depth of the H&S pattern, I believe a deeper fall to the next volume support near $100 is possible. (Target 2)
I hope to build a small short position on the next bounce.
I'll add more once I see confirmation of price below the neckline.
CRWD at SupportGreat support at 200 MA and if holds above it will bullish momentum in the market we could see the upside.
