$CRWD $350 retestHi, sensing a flip here. $350 big support looking to retest in week or two.
Short term puts.
WSL
1CRWD trade ideas

Consider Going Long on Crowdstrike: A Strategic Insight - Key I- Key Insights: CrowdStrike remains a formidable player in the cybersecurity
market, buoyed by the AI-driven Falcon platform. Despite recent market
fluctuations, its growth trajectory and strategic innovation suggest
potential for future recovery, making now a possible entry point for long-
term investors interested in cutting-edge cybersecurity solutions.
- Price Targets: For those considering a long position, next week’s targets are
as follows:
- T1: $363.00
- T2: $375.00
- S1: $340.00
- S2: $330.00
These levels suggest potential upward movement while defining risk thresholds.
- Recent Performance: CrowdStrike has shown mixed performance amidst robust
growth and innovation. Recent sell-offs have tested institutional support
levels, reflecting a period of volatility. This requires vigilance from
investors to identify optimal entry and exit points and underscores the
importance of timing in trading strategies.
- Expert Analysis: Market experts are optimistic about CrowdStrike's recovery
potential, emphasizing its AI technological strengths. Alongside peers like
Planet Fitness and Microsoft, CrowdStrike is expected to benefit from
industry advancements. Despite technical volatility, its foundational
strength poses a viable opportunity for investors.
- News Impact: The latest fiscal Q4 2024 earnings report, which exceeded
expectations with a non-GAAP EPS of $0.13, underscores CrowdStrike's
strategic growth and operational effectiveness. This positive financial
performance aids in alleviating some investor concerns following continued
fluctuations in stock prices, reinforcing its leadership in the
cybersecurity arena.

Compelling Entry OpportunityKey arguments in support of the idea.
The stock has adjusted to an attractive valuation.
Cybersecurity continues to be an essential priority for businesses and government entities alike.
AI and automation serve as significant competitive advantages for CrowdStrike.
Investment Thesis
CrowdStrike Holdings, Inc. (CRWD) is a leading U.S. cybersecurity firm that specializes in providing cloud-based solutions and endpoint protection. The company is esteemed for its CrowdStrike Falcon platform, which integrates artificial intelligence, machine learning, and behavioral analytics to thwart cyber threats in real-time. Falcon protects businesses and government entities from cyberattacks, such as viruses, ransomware, and zero-day vulnerabilities. Established in 2011, CrowdStrike is headquartered in Austin, Texas.
The stock price of CrowdStrike Holdings has adjusted to attractive levels. CrowdStrike’s stock experienced a downturn, mirroring the trend of the broad market index, due to weak U.S. macroeconomic data for February, trade policy tightening, potential changes in U.S. macroeconomic and fiscal policy, and statements from Trump about the possibility of a U.S. recession. We think these factors are already priced into the stock, suggesting an upside potential from the current levels, reinforced by the robust fundamentals underpinning CrowdStrike’s business.
Cybersecurity continues to be an essential priority for both businesses and government agencies. Unlike other IT expenses that might be reduced during economic downturns, investment in data and infrastructure protection remains indispensable. The prevalence of cyberattacks is unaffected by economic conditions; in fact, they often surge during crises. Historical evidence highlights notable increases in phishing, account breaches, and ransomware activities during periods of economic instability. Additionally, strict regulatory frameworks such as GDPR, NIST, and SOC 2 impose significant penalties for non-compliance, compelling companies, even those struggling financially, to maintain rigorous cybersecurity measures. Amid the widespread transition to remote work and cloud-based technologies, securing digital infrastructure is of utmost importance. CrowdStrike’s Falcon platform is strategically positioned to address these needs, offering a holistic solution that supersedes traditional endpoint, cloud services and corporate accounts protection systems. Organizations striving to reduce IT budgets are increasingly adopting platform solutions like Falcon XDR, which enhances cost efficiency and defense effectiveness.
AI and automation serve as significant competitive advantages for CrowdStrike. The company distinguishes itself from competitors through its innovative use of artificial intelligence and machine learning. Unlike conventional antivirus tools that rely on signatures, Falcon processes up to 2 trillion events daily, predicting attacks before they occur. Such automation reduces labor costs and reliance on costly IT personnel, especially crucial in the context of rising inflation and increasing wage pressures. AI solutions enable businesses to achieve both cost savings and superior protection. Moreover, the predictive accuracy of CrowdStrike’s AI improves with the breadth of data it processes, creating a network effect that strengthens its competitive edge over rivals such as Palo Alto Networks and SentinelOne.
The target price for the shares is $350, the rating is Sell. We recommend setting a stop loss at $280.

$CRWD: Crowdstrike – Cybersecurity Titan or Overvalued Hype?(1/9)
Good afternoon, investors! ☀️ NASDAQ:CRWD : Crowdstrike – Cybersecurity Titan or Overvalued Hype?
With NASDAQ:CRWD at $322, is this cyber guardian still leading the pack or is it time to cash in? Let's dive into the digital trenches! 🔍
(2/9) – PRICE PERFORMANCE 📊
• Current Price: $ 322 as of Mar 11, 2025 💰
• Recent Moves: Down from $360+ post-Q4, per X posts 📏
• Sector Trend: Cybersecurity demand remains robust, per market insights 🌟
It’s a steady ride with potential for growth! ⚙️
(3/9) – MARKET POSITION 📈
• Market Cap: ~$75B (based on 232.5M shares) 🏆
• Operations: Leader in endpoint security and threat intelligence ⏰
• Trend: Expanding into AI-driven security solutions, per recent developments 🎯
Firm, standing tall in the cyber battlefield! 🚀
(4/9) – KEY DEVELOPMENTS 🔑
• Earnings Win: Q1 FY25 beat estimates, guidance raised, per X posts 🔄
• Cyber Boom: Threats fuel demand, per Mar 6 chatter 🌍
• Market Reaction: Stock jumped, then dipped, per X sentiment 📋
Battling, with innovation driving the narrative! 💡
(5/9) – RISKS IN FOCUS ⚡
• Competition: Intense from Palo Alto Networks, Zscaler, etc. 🔍
• Valuation: High P/E ratio may concern some investors 📉
• Regulatory Shifts: Potential new laws impacting data privacy ❄️
Navigating challenges in a dynamic landscape! 🛑
(6/9) – SWOT: STRENGTHS 💪
• Market Leader: Dominant in endpoint security 🥇
• Innovation: AI and ML-driven solutions keep it ahead 📊
• Financial Health: Strong cash position, no debt 🔧
Built to withstand cyber storms! 🏦
(7/9) – SWOT: WEAKNESSES & OPPORTUNITIES ⚖️
• Weaknesses: High valuation, competitive pressures 📉
• Opportunities: Growing demand for cloud security, new market segments 📈
Can it capitalize on the digital expansion? 🤔
(8/9) –📢Crowdstrike at $322—your investment move? 🗳️
• Bullish: $400+ soon, cyber threats fuel growth 🐂
• Neutral: Holding steady, balancing risks and rewards ⚖️
• Bearish: $280 drop, overvalued in a cooling market 🐻
Cast your vote below! 👇
(9/9) – FINAL TAKEAWAY 🎯
Crowdstrike’s $322 stance shows resilience 📈, but cautious investors eye valuation and competition 🌿. Dips are our DCA playground 💰. Grab ‘em low, ride the wave! Gem or bust?

CRWD .. Crowdstrike got struck downCheck out this interesting use of an indicator i created for those who take this chart seriously...not an advertisement cause I'm not selling...crap costs too much already. But just ask and well get you this puppy for you to trade with as you please
But interesting how price action and momentum and sentiment may not always align...

CrowdStrike (CRWD) ... Time to Clap ??Big earnings miss and softer forward looking statements from CrowdStrike today.
Sold off to the six month $343 support area and bounced with the general market.
A continuation of this tech rally should help CRWD.
A Wolfe Wave Pattern and a Bullish Harmonic Butterfly are present in the 1H timeframe.
I'd try to buy a retest of the 1-3 line breakout at $360 with a tight stop and with overall market strength.
A clearer Tariff stance from the Waffle House might also help.
A gap has to be filled at $370 and a $400 target is not unreasonable.
Stay nimble. Not investment advice and do your own due diligence.
S.

CrowdStrike (CRWD) at a Crossroads: Breakdown or Bounce?
CRWD has been in an uptrend, trading within a rising channel.
The recent breakdown below 380 suggests weakening momentum.
RSI at 45.87 shows declining strength, but not yet oversold.
Bear Case
The stock has broken below the rising channel, signaling potential trend reversal.
If it fails to reclaim 380, next key supports are at 298 - 308 and 254.35.
Gap below 300 could act as a magnet if weakness continues.
Bull Case
If CRWD reclaims 380, the uptrend could resume.
A break above 365 - 380 resistance zone may push it back toward 400+.
Verdict: Leaning Bearish
Trend: Broken Uptrend, Risk of Reversal
Bias: Bearish unless 380 is reclaimed
Watch: 365 - 380 as key resistance, 298 - 308 as major support
Unless CRWD reclaims its trendline, the risk remains to the downside with a test of 300 levels possible.

$CRWD - just watch for nowNASDAQ:CRWD I don’t think it’s done falling.
The 200 DMA and the VWAP may provide some support and a potential reversal area. However, I believe it’s heading close to the $300 area, which is the prior top.
I will just keep it on the watch.

CrowdStrike’s Earnings Miss Sends Shares Tumbling: What’s Next?CrowdStrike Holdings Inc. ( NASDAQ:CRWD ) faced a significant setback in the market after issuing disappointing earnings guidance, leading to a sharp decline of nearly 9% in extended trading. While the cybersecurity firm reported solid revenue growth, concerns over weaker-than-expected earnings projections overshadowed its performance.
Earnings Disappoint, But Revenue Holds Strong
CrowdStrike reported earnings per share (EPS) of $1.03 for the quarter. However, this number wasn’t directly comparable to analysts’ expectations. Revenue came in at $1.06 billion, surpassing the forecasted $1.03 billion and marking a 25% year-over-year increase from $845.3 million in the prior period.
Despite the revenue beat, the company posted a net loss of $92.3 million, or 37 cents per share, compared to a net income of $53.7 million, or 22 cents per share, a year earlier. This shift into the red raised investor concerns, especially given the company's prior profitability momentum.
Technical Outlook
At the time of writing, NASDAQ:CRWD is down 7.3% in premarket trading, reflecting strong selling pressure. The stock is approaching oversold territory, with the Relative Strength Index (RSI) sitting at 37.80. A further decline could push it below the key 30 level, indicating a deep oversold condition and potential for a short-term bounce.
From a trend perspective, NASDAQ:CRWD is teetering on the edge of a bearish breakout. If the market opens with further downside pressure, a breach of key support levels could trigger an extended decline. Investors should watch for potential support around $340, while resistance remains near $380.

$CRWD. $378 long suppprt held NASDAQ:CRWD -stock tested and held long term support at $378. Stock has next level to break at 390 which is 50 EMA . If it breaks, we can see $400 and $405. If it fails,waiting for 378 support to breaks. Stock is decent on indicators.

CRWD – High Momentum Stock Breaking into Key Levels!CRWD has shown strong bullish momentum, breaking key resistance levels and moving into a critical price zone. The current price action suggests further upside potential, but traders should be mindful of upcoming resistance areas.
📈 Technical Analysis:
* Trend & Price Action: CRWD has been making higher highs and higher lows, establishing a strong uptrend.
* Key Resistance: The price is currently testing the $450 - $460 zone, which aligns with significant gamma resistance and call wall pressure.
* Support Levels: The closest support is $431, followed by a stronger demand zone around $422 - $415.
* Volume Analysis: Recent high buying volume confirms bullish sentiment.
* Momentum Indicators:
* MACD: Shows a bullish crossover, but the momentum is slightly cooling off.
* Stochastic RSI: Overbought levels suggest a potential pullback before further continuation.
🏦 GEX & Options Flow Insights:
* Call Walls: Heavy resistance is seen near $460, which could act as a short-term ceiling.
* Put Support: The strongest put walls are around $415, making this a key level to watch for dips.
* IV & Options Sentiment:
* IVR: 41.9, suggesting moderate implied volatility.
* GEX Sentiment: Bullish, with positive net gamma exposure favoring upside moves.
* Calls vs. Puts: Call volume at 32.7%, indicating traders are actively positioning for an upside move.
🎯 Trade Scenarios:
✅ Bullish Setup:
* Entry: On a breakout above $455 - $460 with volume confirmation.
* Target 1: $470
* Target 2: $480
* Stop-loss: Below $440 to minimize risk.
❌ Bearish Setup (Rejection Scenario):
* Short Entry: If price struggles at $460 and reverses with bearish confirmation.
* Target 1: $431
* Target 2: $422
* Stop-loss: Above $465.
⚠️ Final Thoughts & Risk Management:
* CRWD has strong bullish momentum, but traders should be cautious near key resistance at $460.
* Watch options flow and volume trends to confirm the next move.
* Manage risk effectively with stop-loss strategies to protect gains.
📌 Disclaimer: This analysis is for educational purposes only and does not constitute financial advice. Always conduct your own due diligence before trading.

Looking likely at a retrace to 380s based on overly bought A simple practice, from a basic 101, stands out as the chart pattern has told us numerous times, the last candle, the overbought areas to reconcile all this and more expect a correction.

CRWD - LONGTook a long on CRWD today ....
Not really exciting theme for me but a necessary one that's in demand :
1/2 gap before GLB ( and recent GLB breakout )
Tight clean moves , price action healthy
Good RS
Great EPS and Revenue

CrowdStrike - High FIve Trade of the Week!H5 Trade of the Week: NASDAQ:CRWD
Check it out 👇
Not financial advice

Speculative Madness: The Market’s Bubble Stocks Some stocks areSpeculative Madness: The Market’s Bubble Stocks
Some stocks aren't just overvalued—they're in full speculative bubble mode. Fundamentals? Irrelevant. When euphoria takes over, rationality disappears.
Here’s my list of bubble stocks that scream unsustainable pricing:
SBUX, T, PLTR, BMY, PYPL, NFLX, GS, ISRG, ARM, C, SHOP, BSX, SPOT, UBS, IBKR, RELX, CEG, CRWD, MSTR, MMM, DASH, COF...
And let’s not forget the obvious: TSLA, META, AMZN, AVGO, GOOGL, JPM, MA, V, WMT.
Honestly, the entire banking sector, brokers, and tech are in bubble territory.
What the hell is going on with this market? Why are algos just buying, buying, buying, squeezing all the shorts?! Unbelievable.
The dump will be insannnnnnnne!!! 🚨

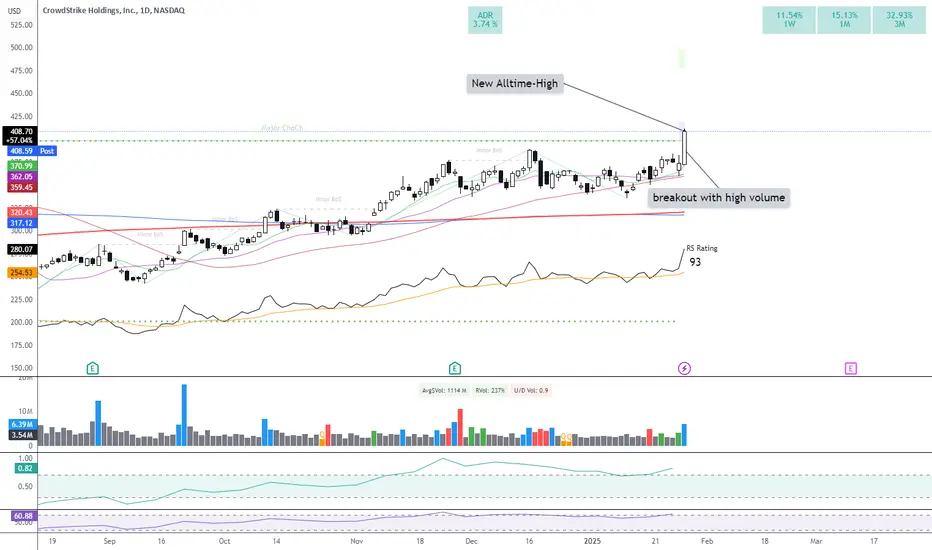
$CRWD closing above 20 Day SMA $ and FIB Retracement levelsThe bellwether cybersecurity cos Crowdstrike had a very bad 2024 after the disastrous failed upgrade which caused major outages globally. Yesterday the stock closed at 408 $ which is at an ATH. Today in a week market it is still above the 20 Day SMA @ 362 $ and the 1.0 Fib retracement level @ 396 $. If these key support levels hold it is good idea to go long on $CRWD. In our Daily Dose of Chart : 07 Jan 2025 we spoke about a bullish Head and shoulders pattern. But this pattern is now invalidated. So, within the tech sector we are seeing intra sector rotation with NASDAQ:NVDA @ its 200 Day SMA support and NASDAQ:CRWD @ ATH. I think this weakness in Semis vs Cybersecurity will continue for some time. Please check out my post on 27th Jan for NASDAQ:NVDA trade idea.

Beautiful breakout CRWD breaks perfectly out of a range and thus marks a new all-time high.
CRWD has been moving in a range with low volume since November 2024. Today is a perfect breakout. The breakout was confirmed under conspicuously high volume.
CRWD is also a top growth candidate in the hot cybersecurity sector. NASDAQ:CRWD
$CRWD Up 29% Following 100% Accuracy in SE Labs Ransomware TestCrowdStrike Holdings, Inc. (NASDAQ: NASDAQ:CRWD ), a global leader in cybersecurity, has made headlines with a groundbreaking achievement in the 2024 SE Labs Enterprise Advanced Security (EDR) Ransomware Test. The company’s Falcon® platform achieved an unprecedented 100% detection, 100% protection, and 100% accuracy against ransomware threats, setting a new benchmark in cybersecurity. This news has fueled a significant 29% surge in NASDAQ:CRWD ’s stock value, signaling strong investor confidence.
Achievements
In the largest real-world ransomware test to date, CrowdStrike ( NASDAQ:CRWD ) demonstrated its superiority by thwarting all known and unknown ransomware threats without a single false positive. SE Labs awarded CrowdStrike its AAA Award for Advanced Security EDR Protection for the third consecutive year, citing the company’s ability to “exceed the challenges” posed by increasingly sophisticated cyberattacks.
Key Highlights from the Test:
- Unified Protection Across the Attack Lifecycle: CrowdStrike’s Falcon platform provided complete detection and protection at every stage of the attack, offering security teams detailed insights into network breaches and lateral movement attempts.
- AI-Driven Detection and Response: Powered by advanced behavioral AI and machine learning, the platform blocked all direct ransomware attacks, including zero-day threats, while maintaining flawless accuracy.
- Cloud-Native Architecture: CrowdStrike’s cloud-native design enabled real-time threat detection and rapid response without straining system resources, effectively neutralizing advanced ransomware families like LockBit and GandCrab.
Simon Edwards, CEO of SE Labs, praised CrowdStrike, stating, “Every year, we raise the bar to mirror the increasing complexity of real-world attacks, and CrowdStrike not only meets but exceeds these challenges.”
Technical Analysis
As of the time of writing, NASDAQ:CRWD is up 7.85% in intraday trading, following a 29% surge in the past 24 hours. This rally marks a significant breakout, as the stock surpassed the psychological resistance level established in July 2024. The recent price action reflects strong bullish momentum, positioning NASDAQ:CRWD for potential new highs.
Key Technical Indicators:
- Relative Strength Index (RSI): Despite the price surge, the RSI remains at 68.77, suggesting more room for upward movement before reaching overbought territory.
- Support and Resistance Levels: If a pullback occurs, immediate support lies at the 61.8% Fibonacci retracement level. This zone serves as a key buying opportunity for traders, reinforcing the stock’s potential for a continued rally.
- Market Comparison: While NVIDIA has faced a historic loss of nearly $600 billion in market capitalization, CrowdStrike’s rise highlights its resilience and growing prominence in the tech sector.
Outlook and Implications
CrowdStrike’s achievements underscore its leadership in the cybersecurity space. The Falcon platform’s success not only bolsters the company’s reputation but also positions it as a preferred choice for enterprises seeking robust ransomware protection. As modern adversaries grow more sophisticated, CrowdStrike’s innovative approach ensures comprehensive security across endpoints, cloud, identity, and data.
For investors, NASDAQ:CRWD ’s recent performance and technical setup indicate a promising trajectory. With its psychological resistance breached and strong fundamentals in place, the stock is poised to attract further attention, potentially reaching new highs in the near term. Traders should monitor the 61.8% Fibonacci level for potential entry points in case of a retracement.
Conclusion
CrowdStrike’s perfect scores in the SE Labs ransomware test and its subsequent stock surge underscore the company’s innovation and resilience. As the cybersecurity landscape evolves, CrowdStrike continues to set the standard, ensuring organizations stay one step ahead of adversaries. With its unified, AI-driven approach, the Falcon platform empowers businesses to tackle the most sophisticated threats, solidifying CrowdStrike’s position as a market leader in cybersecurity.

CRWD Long TradeLong entry: 373.90, based on a breakout of a key resistance level.
🔹 Stop-loss: 371.02 (below recent support)
🔹 First target: 382.84 – potential resistance zone, 50% profit-taking
🔹 Second target: 389.13 – continuation if momentum sustains
📈 Trade rationale:
1D chart: Uptrend intact, supported by a 22 Bullish Reversal on the 1H chart.
4H chart: Breakout above the last resistance with bullish momentum.
High ATR signals potential for a significant price movement.
🔎 Risk management:
Risk-reward ratio of 1:3 for the first target and 1:5 for the second.
Entry will be confirmed by price stability above 373.90 to avoid a false breakout.

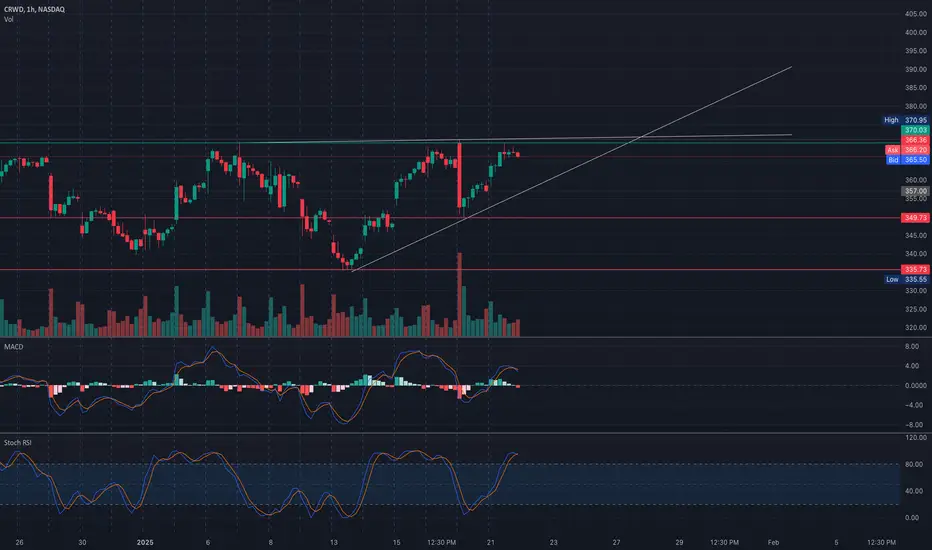
CRWD at Critical Resistance – What's Next? Jan. 22Current Price Action:
* CRWD is trading at $366.20, nearing a significant resistance zone at $370, which aligns with the recent swing high.
* The stock is forming an ascending triangle pattern, signaling potential breakout opportunities.
* Immediate support is at $349.73, with stronger support at $335.73, based on previous demand zones.
MACD:
* Bullish momentum is slowing, with the MACD lines flattening and histogram bars reducing. This suggests potential consolidation or a pullback.
Stochastic RSI:
* Overbought conditions persist, with Stochastic RSI above 90, hinting at a possible short-term correction.
GEX Analysis (Options Data)
Key Levels:
* Resistance Levels:
* $370 (97.49% Call Wall) – This is a critical gamma resistance where heavy call options activity could limit upside momentum.
* $380 (69.19% GEX8) – Secondary resistance, signaling a strong barrier if the breakout above $370 occurs.
* Support Levels:
* $355 (HVL Zone) – Acts as a pivot for buyers to defend against further declines.
* $337.5 (15.35% 2nd Put Wall) and $330 (19.76% Put Support) – Strong downside supports based on put option activity.
Options Sentiment:
* IV Rank: 11.7, indicating relatively low implied volatility.
* Calls: 45.9% of open interest, showing a mildly bullish options bias.
* GEX (Gamma Exposure): Positive, signaling potential price support at current levels.
Trade Setups
Bullish Scenario:
* A breakout above $370 could see CRWD test $380 and potentially $385, especially if volume accompanies the move.
* Entry: $370.50
* Stop-Loss: $365
* Targets: $380, $385
Bearish Scenario:
* Failure to break above $370 could lead to a pullback toward $349.73 or lower.
* Entry: $365
* Stop-Loss: $370.50
* Targets: $355, $337.5
Outlook
CRWD is at a critical juncture. A breakout above $370 would signal bullish strength, but overbought conditions on Stochastic RSI suggest caution. Traders should watch for increased
volume on a breakout or a potential rejection at resistance for a pullback play.
Disclaimer: This analysis is for educational purposes only and does not constitute financial advice. Always perform your own research and manage risks effectively before trading.
Long on Crowdstrike: Target $400 with Strong Support at $340- Key Insights: CrowdStrike is showing promising momentum amidst a positive
market sentiment. The demand for its cybersecurity solutions is increasing
as cyber threats evolve, enhancing investor confidence. Market participants
see upside potential to the resistance level, supported by resilient buying
interest at current levels.
- Price Targets: Next week targets: T1 at $375, T2 at $400; Stop levels: S1 at
$340, S2 at $330.
- Recent Performance: CrowdStrike is trading at $359.02, demonstrating solid
performance with an upward trajectory. The stock has bounced back around the
S1 level, indicating strong support has emerged.
- Expert Analysis: Analysts remain bullish on CrowdStrike, anticipating
continued growth in the cybersecurity sector. The overall sentiment supports
tech stock investments, with CrowdStrike well-positioned to benefit from
this trend due to its innovation and market agility.
- News Impact: While no major news events were reported, the overall
cybersecurity landscape is changing rapidly, with any strategic developments
or partnerships potentially impacting stock performance positively.

Pretty simple dynamic here in all probability this is a Squeeze As the symmetrical triangle indicates, this is quite close to the lift-off of newer proportions, a key area to highlight, and this ping-pong shows 100 crossing over the 200, getting closer each day. Still, I don't think we're quite there yet, as some indicators have stated that we could sit anywhere in the 340s, simply ready to pull the trigger with so many setups creating many opportunities to go long.

swing trading for December 23 Crowdstrike Holdings(CRWD)CRWD Is Trading Now Using a Price Channel Pattern. Price channels are continuation patterns of parallel trend lines. They indicate that the price is likely to continue moving within the channel.
The breakout from the channel can signal significant trend changes. An upward channel suggests a bullish trend, while a downward channel indicates a bearish trend.
