[S-009] CISCOTrading idea number S-009 | CISCO stock could raise to 60 USD area.
The setup is positive: The stock is trading above its 20- and 50-day moving averages, while prices have crossed the upper daily Bollinger band.
The RSI is above 50 and The MACD is positive above its signal line, both still showing room to climb on the weekly time frame.
📈 Long Entry at 55.98
💰 Take Profit at 59
💸 Stop Loss at 53.85
1CSCO trade ideas

Buying CISCO on dips.Cisco Systems - 30d expiry - We look to Buy at 54.71 (stop at 52.71)
Daily signals are bullish.
A lower correction is expected.
There is no clear indication that the upward move is coming to an end.
50 1-day EMA is at 54.50.
The sequence for trading is higher highs and lows.
Our profit targets will be 59.71 and 60.71
Resistance: 56.40 / 57.00 / 58.19
Support: 55.54 / 55.00 / 54.00
Please be advised that the in formation presented on TradingView is provided to Vantage (‘Vantage Global Limited’, ‘we’) by a third-party provider (‘Everest Fortune Group’). Please be reminded that you are solely responsible for the trading decisions on your account. There is a very high degree of risk involved in trading. Any information and/or content is intended entirely for research, educational and informational purposes only and does not constitute investment or consultation advice or investment strategy. The information is not tailored to the investment needs of any specific person and therefore does not involve a consideration of any of the investment objectives, financial situation or needs of any viewer that may receive it. Kindly also note that past performance is not a reliable indicator of future results. Actual results may differ materially from those anticipated in forward-looking or past performance statements. We assume no liability as to the accuracy or completeness of any of the information and/or content provided herein and the Company cannot be held responsible for any omission, mistake nor for any loss or damage including without limitation to any loss of profit which may arise from reliance on any information supplied by Everest Fortune Group

A Simple Method Of Evaluating Trade Setups For Everyone - PART IThis is a simple example of how anyone can attempt to understand price action, trade setups, and determine if the current trade setup is valid for any trading action.
Unless you have a trading system that helps you identify highly successful trade setups, most people struggle to find opportunities before they turn into breakout trends (up or down). Ideally, most traders want to get into trades before the big breakout, or breakdown, happens.
This video, part I of an extended series, will help you learn to use simple tools to identify qualified trade setups from invalid setups.
You can trade whatever you want. But remember, the trend is your friend, and learning to understand price theory, trends, channels, and support/resistance is all you need to make better decisions.
Watch this video to see if it helps you. Over the next few weeks, I'll create more videos highlighting simple techniques to help you become a better trader. I'll review dozens of charts and highlight what works and what doesn't.
Trading is a matter of managing risks while attempting to generate profits. This will be a great way for me to share my thoughts with all of you while trying to help you learn techniques to help you build solid skills.
Hope you enjoy this first video.

CISCO, Possible Inverted H&S, These Level To Consider Now!Hello Traders Investors And Community, welcome to this analysis where we are looking at the stock value CSCO (CISCO) 4-hour weekly timeframe perspective, the recent events, the current meaningful formation building, what to expect the next times, which level are important to hold and how to handle upcoming situations out of a trading perspective. CSCO was since the corona crisis technically one of the weaker stocks trading below the 55-EMA measure and way below its established all-time-high, now this does not mean it is bearish forever and continue as I detected some signals which can indicate a follow-up of this stock to the main market, but the importance in the CISCO environment here is that it needs to confirm certain levels before such a follow-up can be considered at all but when these conditions fulfill the stock has some potential in the current structure building up.
In my chart, you can watch that the stock just forming somewhat of a correction currently where it is correcting the uptrend established since the corona bottoms seen this year, the incoming volatility is higher but it can slow down when nearing to the support in the structure which the stock has at the 300-EMA marked in black where also important Fibonacci-supports lie. Therefore it is important that the stock bounces here and it is a needed condition in order to complete the big possible head and shoulder formation seen in my chart marked in blue, which will confirm when the stock stabilizes at the EMA and bounces from there, this move is highly important because when this does not happen and the stock falls below it this invalidates the whole head and shoulder formation within the invalidation range marked with the arrows in red where the stock will increase bearishness in this area.
When the stock manages to hold the EMA support and bounce from there a move towards the blue neckline can be expected, when this happens it is important to move above it the best with a volatile upside move closing above the neckline which will confirm the inverse head and shoulder formation which will provide the proper entry setup for entering a position here as this is seen in my chart, in this case, the stock can bounce from the 55-EMA in green which will be a good point for opening a position, although the aggressive immediate entry approach is also possible here the conservative will be better to wait on the confirmation and then enter. When this scenario is playing out properly there can be decent upside targets expected which can even exceed the established all-time-highs therefore a smart consideration to open positions before the masses enter, remember to wait on confirmation which is the best process here.
In this manner, thank you for watching the analysis, support for more market insight, a good weekend and all the best!
"Trading effectively is about accessing possibilities, not certainties."
Information provided is only educational and should not be used to take action in the market.

CSCO: correction time?A price action below 57.00 supports a bearish trend direction.
Further bearish confirmation for a break below 56.60.
The target price is set at 55.00.
The stop-loss price is set at 58.00.
Wave analysis suggests a couple of alternatives.
The price action was corrected from overbought territory.
Remains a very risky trade.

CSCO H&S IdeaI don't think this is very probably, however it is possible. I could make an argument for a head and shoulders pattern starting to form on the monthly. and previous support/resistance levels could indicate future support... Indicating potential entry zones.
The drawback to this idea is that I didn't do this in log scale.. which I like to do when looking at time frames that span this long. I will try and follow this up with a log version of this and see if any patterns pop out at me.

Top Performing Low Volatile Stocks so Time to ActUnveiling the Top Performing Low Volatile Stocks - Time to Take Action! I just scanned 6800 top performers!
I am thrilled to share with you the results of our latest scanning endeavor, where we have discovered 18 top performing very low volatile stocks that are poised to bring you remarkable returns. So, without further ado, let's dive into the details and explore some exciting investment opportunities!
Our meticulous scanning of the market has revealed a selection of stocks that have consistently demonstrated low volatility while delivering impressive performance. These stocks not only provide stability in uncertain times but also offer tremendous growth potential. It's like finding a hidden treasure chest, just waiting to be unlocked!
Now, let's get down to business. I encourage you to consider the following stocks for your investment portfolio:
NHC (National HealthCare Corporation): With a strong track record in the healthcare sector, NHC has shown remarkable resilience and steady growth. Investing in this gem could be a healthy addition to your portfolio.
CSCO (Cisco Systems Inc.): As a leading technology company, CSCO has consistently proven its ability to adapt and innovate. Don't miss out on the opportunity to ride the wave of their success.
IBKR (Interactive Brokers Group, Inc.): With its cutting-edge trading platform and extensive global reach, IBKR offers a world of possibilities for traders seeking reliable investments.
PSH (Pershing Square Holdings, Ltd.): Managed by renowned investor Bill Ackman, PSH has been a consistent performer and could be a valuable addition to your investment strategy.
These stocks have demonstrated resilience, stability, and the potential for significant returns. While past performance is not indicative of future results, it's always wise to consider these gems when making investment decisions.
Now, I urge you to take action and seize this opportunity to enhance your portfolio. Conduct your own research, review the financials, and evaluate the potential risks and rewards. Remember, investing is about finding the right balance between risk and reward, and these stocks might just be the perfect fit for your goals.
Don't let this chance slip away! Take the necessary steps to explore these stocks further, and who knows, they might become the shining stars of your investment journey.
If you have any questions or need further assistance, please do not hesitate to reach out by sending posting a comment. We are here to support you and help you make informed investment decisions.

CSCO Monthly (NVDA mentioned)CSCO, synonymous with the Internet. Year 2000 darling. The internet was wild west, the future. It did become the future, and is everywhere in our life today. If you bought CSCO at 82 it during the hype in March 2000, you would still be a bag holder 23 years later.
NVDA chart looks almost identical to the CSCO chart of March 2000. I am not saying that it does not have good potential, but as a long portfolio holder I try my best not to buy high and sell low. Whether AI is another internet bubble remains to be seen, so I wait for better setups.
CSCO is a fine company with excellent metrics, 8.8 percent free cash flow yield is an indicator of a good bargain now. Today I would look at it as a long, but have not developed an entry strategy yet.
If you recently bought long NVDA, good luck. Scalping is another issue altogether.

CSCO - trend on the expectation of volatility after the report- a speculative trend on the expectation of volatility after the report. - this has happened 5 times in a row and even in a bear market.
- there is an opportunity to take a cheap short option with minimal risk.

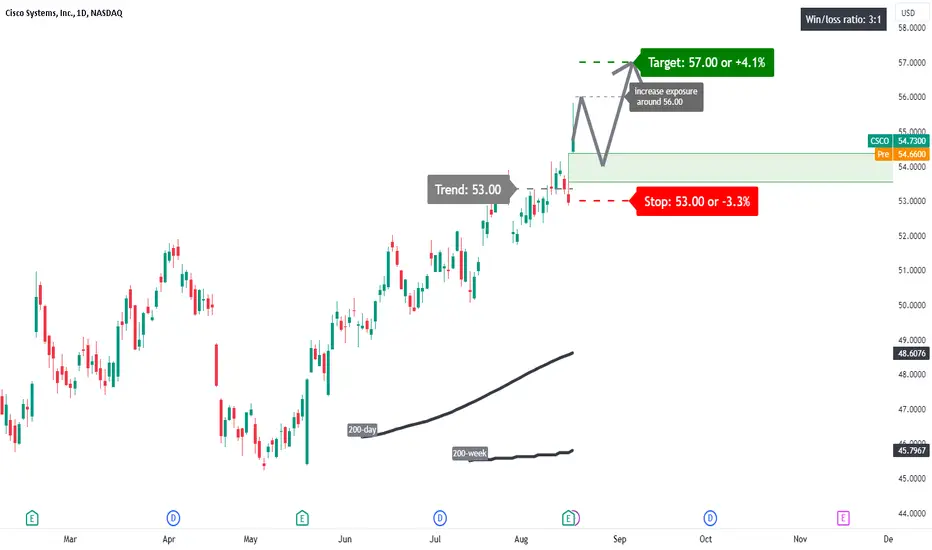
CSCO: gap trade?Is this a breakaway gap: These gaps occur at the end of a price pattern and signify the beginning of a new trend. It is challenging to trade these as they can indicate strong momentum.
A price action above 53.00 supports a bullish trend direction.
Further bullish confirmation for a break above 56.00.
The target price is set at 57.00.
The stop-loss price is set at 53.00 as well.
The stock is already overbought and one might need to wait for a pullback before entering into a position.
CSCO Cisco Systems Options Ahead of EarningsIf you haven`t sold CSCO here:
Or reentered here:
Then analyzing the options chain and the chart patterns of CSCO Cisco Systems prior to the earnings report this week,
I would consider purchasing the 53usd strike price Calls with
an expiration date of 2023-8-18,
for a premium of approximately $1.77.
If these options prove to be profitable prior to the earnings release, I would sell at least half of them.
Looking forward to read your opinion about it.

Cisco Systems, Inc. (‘CSCO’)
Cisco Systems, Inc. (symbol ‘CSCO’) managed to stay afloat their second quarter performance adding around 11% on their share price. The company’s earnings report for the fiscal quarter ending July 2023 is set to be released on Wednesday 16th of August, after market close. The consensus EPS is $0.95 compared to the same quarter of last year at $0.74.
‘As of 30/04/2023 the company's current ratio is around 140% showing that the company is able to repay its short term liabilities with the current assets in hand. Also what is important to mention is that the debt to equity ratio is near all time low (currently at 16%) indicating that the company’s debt levels are constantly decreasing making it an attractive investment for market participants ’ said Antreas Themistokleous, an analyst at Exness
On the technical side the price has been trading in a steady uptrend for the majority of the quarter. In last week it found resistance on the upper band of the Bollinger bands and has since corrected to the downside while the Stochastic oscillator is still near the extreme overbought levels possibly showing that the bullish momentum might still be valid in the market. The faster moving averages ( 20 & 50) are trading above the slower 100 day moving average further supporting the narrative that the bulls might still be stronger than the bears.

CSCO - BULLISH SCENARIOThe market anticipates that Cisco Systems will announce a year-over-year earnings increase due to higher revenues when it releases its results for the quarter ending in July 2023. This widely-known consensus view is crucial for evaluating the company's earnings situation. However, an essential factor affecting the stock's short-term price is how the actual results compare to these expectations.
If the upcoming earnings report surpasses these key expectations, the stock is likely to rise. Conversely, if the results fall short of these estimates, the stock may decline.
While the discussion of business conditions by management during the earnings call will significantly impact the immediate price change and future earnings outlook, it's valuable to consider the likelihood of a positive earnings per share (EPS) surprise as well.
Risk Disclosure: Trading Foreign Exchange (Forex) and Contracts of Difference (CFD's) carries a high level of risk. By registering and signing up, any client affirms their understanding of their own personal accountability for all transactions performed within their account and recognizes the risks associated with trading on such markets and on such sites. Furthermore, one understands that the company carries zero influence over transactions, markets, and trading signals, therefore, cannot be held liable nor guarantee any profits or losses.
Cisco Cup and HandleI noticed a Cup and Handle pattern forming on Cisco Systems - ticker CSCO, on the daily level. What will be my entry points and what are the things to consider:
1. My entry would most likely occur today, 19th of July, since I think that the stock will break from smaller moving averages once the market opens. Those moving averages are 10 and 20, my entry price is sitting at around $52-52.5 price level.
2. Stop loss for this position, in case something goes wrong, will be put at around $49.95 price level, which is just below it's previous low and way below the 10 and 20 moving average line, and around 50MA.
3. My profit point is sitting around $59 price level, but that doesn't mean that I will be exiting my position there. It means that if the price action is strongly acting bearish that I will close my position. If price action is in a strong uptrend, I will surely keep the position open.
4. I am planning on adding to a position at $58 price level, of course, if the price action is going as it should - pointing to a strong bullish move.
I will make sure to update this buy opportunity, but please make sure to do your due diligence when investing.

Buying Cisco at 50-EMA.Cisco Systems - 30d expiry - We look to Buy at 51.21 (stop at 49.21)
The primary trend remains bullish.
Intraday dips continue to attract buyers and there is no clear indication that this sequence for trading is coming to an end.
A lower correction is expected.
This is currently an actively traded stock.
50 1 day EMA is at 51.10. The sequence for trading is higher highs and lows.
Our profit targets will be 56.21 and 57.21
Resistance: 52.78 / 53.89 / 55.00
Support: 51.74 / 50.00 / 49.00
Please be advised that the information presented on TradingView is provided to Vantage (‘Vantage Global Limited’, ‘we’) by a third-party provider (‘Everest Fortune Group’). Please be reminded that you are solely responsible for the trading decisions on your account. There is a very high degree of risk involved in trading. Any information and/or content is intended entirely for research, educational and informational purposes only and does not constitute investment or consultation advice or investment strategy. The information is not tailored to the investment needs of any specific person and therefore does not involve a consideration of any of the investment objectives, financial situation or needs of any viewer that may receive it. Kindly also note that past performance is not a reliable indicator of future results. Actual results may differ materially from those anticipated in forward-looking or past performance statements. We assume no liability as to the accuracy or completeness of any of the information and/or content provided herein and the Company cannot be held responsible for any omission, mistake nor for any loss or damage including without limitation to any loss of profit which may arise from reliance on any information supplied by Everest Fortune Group.

Cisco Pulls Back After JumpingThe Dow Jones Industrial Average has been moving lately, and today we’ll consider index member Cisco Systems.
The networking giant spent about a year trapped below the $52 area. That zone marked a top in April, June and early this month. However CSCO broke above it on July 19 and ran to a new 52-week high. It retreated on Friday to hold the earlier peak. Old resistance may have become new support.
Second, the pullback brought CSCO back to its 21-day exponential moving average (EMA). The 8-day EMA remains also remains above the 21-day EMA. Those points may suggest its recent short-term uptrend remains in effect.
Finally, the stock rallied after its last two earnings reports. Will that positive history provide a tailwind for the shares with the next set of numbers due on August 16?
TradeStation has, for decades, advanced the trading industry, providing access to stocks, options, futures and cryptocurrencies. See our Overview for more.
Important Information
TradeStation Securities, Inc., TradeStation Crypto, Inc., and TradeStation Technologies, Inc. are each wholly owned subsidiaries of TradeStation Group, Inc., all operating, and providing products and services, under the TradeStation brand and trademark. TradeStation Crypto, Inc. offers to self-directed investors and traders cryptocurrency brokerage services. It is neither licensed with the SEC or the CFTC nor is it a Member of NFA. When applying for, or purchasing, accounts, subscriptions, products, and services, it is important that you know which company you will be dealing with. Please click here for further important information explaining what this means.
This content is for informational and educational purposes only. This is not a recommendation regarding any investment or investment strategy. Any opinions expressed herein are those of the author and do not represent the views or opinions of TradeStation or any of its affiliates.
Investing involves risks. Past performance, whether actual or indicated by historical tests of strategies, is no guarantee of future performance or success. There is a possibility that you may sustain a loss equal to or greater than your entire investment regardless of which asset class you trade (equities, options, futures, or digital assets); therefore, you should not invest or risk money that you cannot afford to lose. Before trading any asset class, first read the relevant risk disclosure statements on the Important Documents page, found here: www.tradestation.com .

#CSCO short- or medium-term planConsidering liqudity (see chart) this straddle looks like reasonable. But, straddle (money involved) is not very significant, so be careful.
We primarily consider levels to be activity zones, but not to be a super-fine level for establishing a limit order. Use them in combination with your own strategy, not in alone.

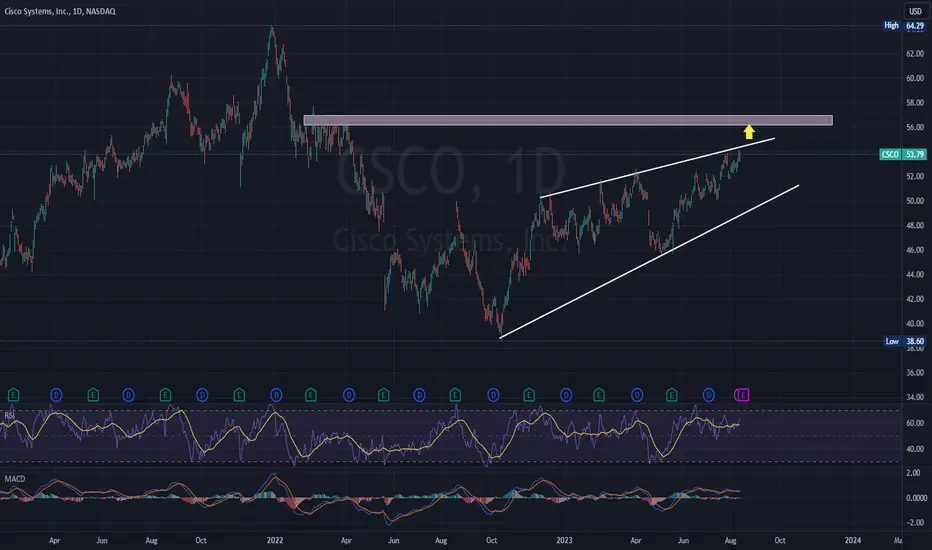
CSCO - Rising Trend Channel [MID -TERM]🔹POSITIVE signals rectangle formation with breakout at 52.14 resistance, next resistance at 55.
🔹RSI bearish diverges against the price, indicating downward reaction.
🔹Technically POSITIVE for the medium long term.
Chart Pattern;
🔹DT - Double Top | BEARISH | 🔴
🔹DB - Double Bottom | BULLISH | 🟢
🔹HNS - Head & Shoulder | BEARISH | 🔴
🔹REC - Rectangle | 🔵
🔹iHNS - inverse head & Shoulder | BULLISH | 🟢
Verify it first and believe later.
WavePoint ❤️


Cisco: You Got This! 💪Cisco is still hesitant and has not yet made it above the resistance at $53.60. However, we expect the share to master this hurdle soon to enter the green zone between $54.48 and $61.38. There it should complete wave 2 in green before turning downwards again. A 37% chance remains, though, that wave alt.2 in green is finished already. In that case, Cisco would skip the green zone and directly drop below the support at $43.39 instead.

What is Happening In The Tech Stock industry?Inside you will see
--
how to check the buying opportunity
--
inside this tech stock
watch the full story here
--
regards,
Lubosi Stocks

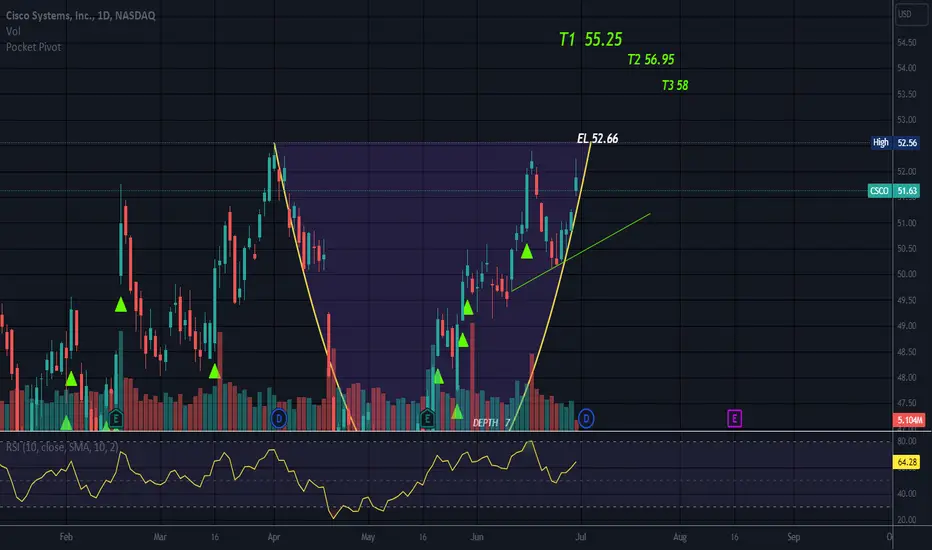
Cup & HandleCup and handle noted.
Price is not to long entry level (EL) which is a tad above the high on the left, or sell side of the cup.
Targets calculated using the depth of the cup which is $7 so this is not a dee cup.
Other patterns could form.
Any pattern can fail.
No recommendation.
$CSCO with a bullish outlook following its earnings #StocksThe PEAD projected a bullish outlook for NASDAQ:CSCO after a negative over reaction following its earnings release placing the stock in drift C with an expected accuracy of 75%.
