1DBK trade ideas

DB, momentum , CandelsI don't understand how all that buying does not raise the price 01 Feb '19 14:30
I have to label SIB " long " I don't have the gravitas to toss DB to the crocodiles.
Seen in candles . . . its not a lot to go on. . . but here it is . I suppose no one knows what is the real picture inside DB. . . . its probably a state secret and the ultimate embarrassment. . .
Parabolas can and should be fit to as high a resolution as available. that is what permits the quadratic extension of 3 points to be extrapolated precisely into the future , or past . the accuracy of the scaling depends of the actual distance tween the three points . very small differences is triangular relationship have large consequences in the quadratic extension of local parabolas.
I still think the efforts to float, prop the stock needs vigor.

DB Hu?How are price action and volume related? There is a proportional rise and fall of the price given specific sale and buy volumes. Of course . I am ignorant. Simply a poet playing with pixels,
Yet, when I run a time line, across the jag and look see for correspondence between the volume and the price Jag, I am a bit confused. How is this straight forwards?
Never for systemically important Banks . I Assume.


Deutsche Bank ($DBK): Weekly - Fractal - Default Risk increasingAs the default risk for Deutsche Bank keep increasing by the day it is now technically ready to move lower towards it's default target of 0.11€ it is still to date the most obvious contagion to the stock market crash of this decade.
However the most likely target on the way down will first be 2.5€ which sits on the trendline from the top notation in May of 2007 which will hit once the fractal from the period 2007-02-26 - 2008-11-17 is activated.
I remain a seller on Deutsche Bank ($DBK) till that target is hit.

DB loosing momentum . . . SIB. . . DB . . .
The world, sort of needs this TBTF, drudge a muck, to Zombie on. Right?
Commerzbank merger? is that going through ? Is that a fix?
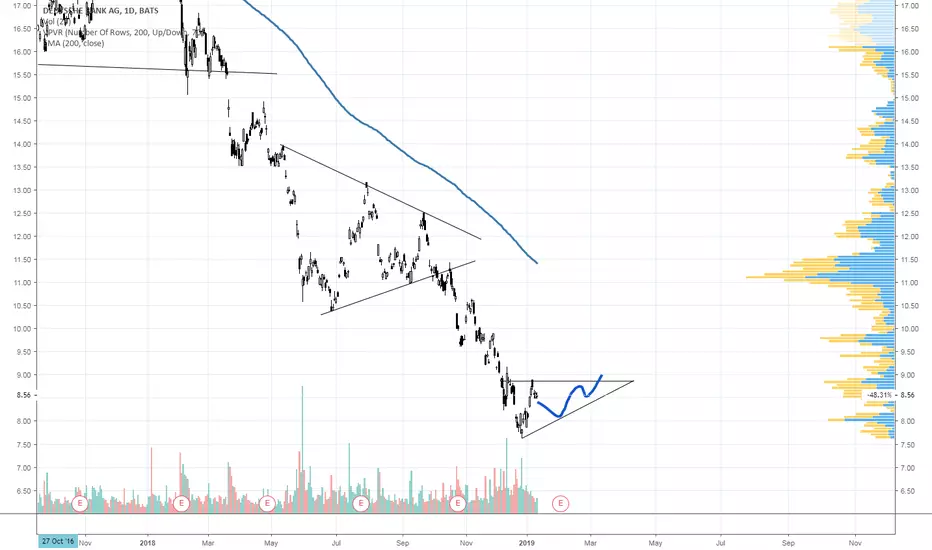
Solid Greens support. I'm actually looking to be positive and cherry. Thin red are trends. The Jag has sprouted Thin Blue Horn from its Dec 24 low. Its lower bound is to low moving into the future; Its upper bound is still not high enough!
I get the impression the volume data has been repopulated. crayon? or Comerz, I can't tell anymore.

Deutsche Bank - still an good buy & continues uptrendwe can see clear up trend structure at this chart. Price moves within ascending channel and rebounces from support and resistance trend line.
Expect another up to 8,50 before we could see an healty and needed correction.
Open prices and take profits are drawn in the chart.
Good luck to all


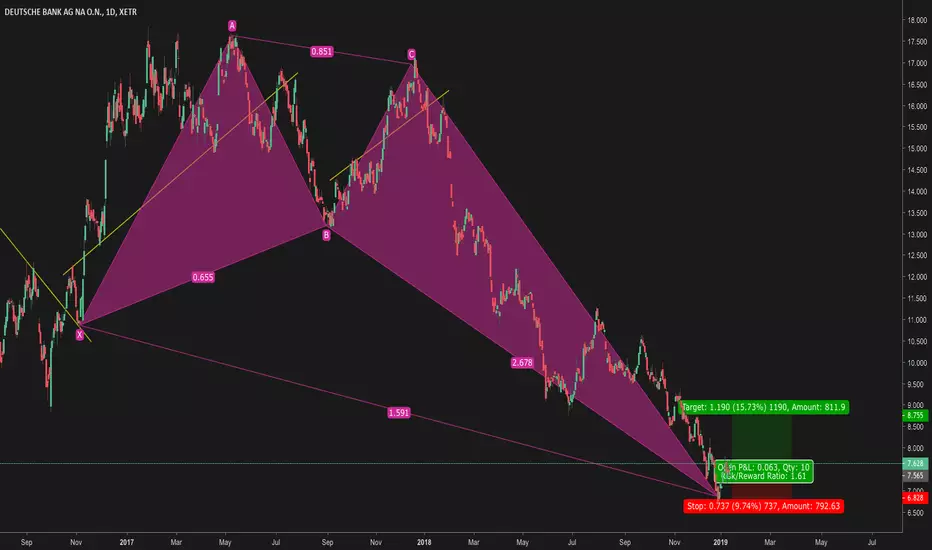
Deutsche Bank: Upside opportunity Upside opportunity towards 15 euros for Deutsche Bank. On the weekly we have a positive divergence both on the RSI (also on the monthly) and on the Chaikin Oscillator. Possible retracement in area 10 euros. Volume Profile confirms the resistance levels.


$DB H&S Bottom after long downtrend$DB H&S Bottom after long downtrend that broke up with strong volume. A quick trade because earnings can mess up any good chart pattern in one day.

Shorting some bad banksI have been waiting for another opportunity to Deutsche Bank and Commerz Bank. And here it is.
Commerz Bank chart:
In case you haven't seen it. There is a netflix serie called Bad Banks. Watch it and you will see why to short these banks. :-)
Bad Banks on Netflix: www.netflix.com

resistance analyisis TA of DB, Deutsche Bank, Break Out!It looks like we are ending a 30 year bear cycle with a decending trinanlge inside a falling channel with imminent brekaout potential! Looking to get on this ship and steer it to treasue island!


DB. . a Narrow Track ahead. The drawing is ELEGANT, it is an Esthetic approach . . The Artist Weg.
Who Knows why and Who , perspires , up there ? DB board room ? Compliance! Am branch! to big to fail and to big to fly?
I see that the Jag wants, needs to skip from think Black to Thin Black, Trice, to succeed . Other wise: Jap Zom Bnk like future?
Solid Red and Blue Solid appear to be its Floor, resistance. below that is TBTF. can it be worth 3 more Dees?
The Jag Just rose over the first thin black parabola. it can do it again twice. ON its own?

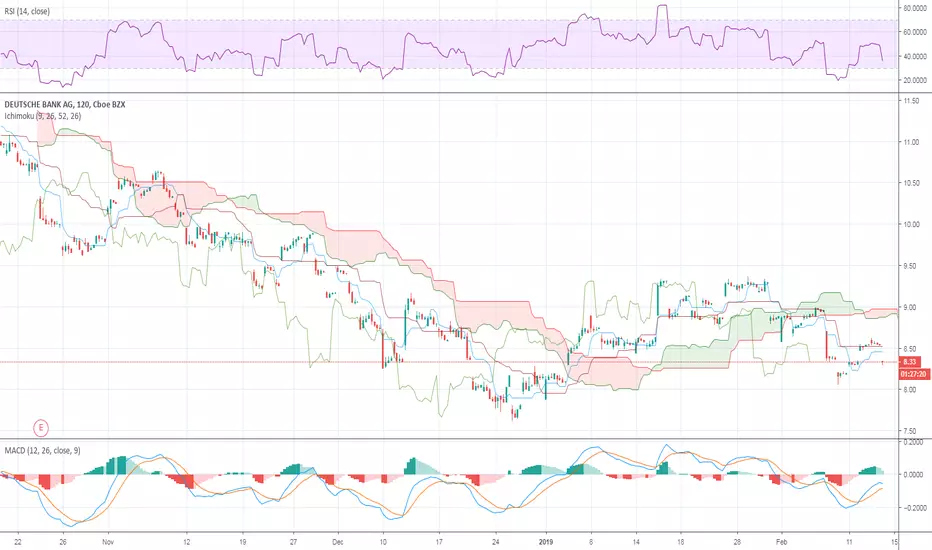
Deutsche Bank - heavy overbought on 1H chartopens and take profit are drawn in the chart. I expect soon an correction because price is heavy overbought and near top in raising channel. Additional there are currently to many dangers in banking area specially with the Deutsche Bank.


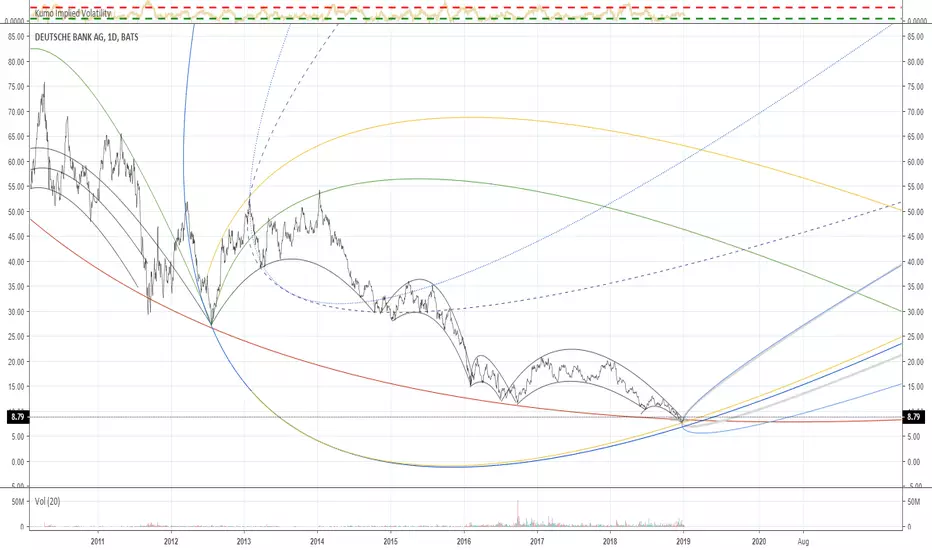
DB, a Historical Day chart in Par- SupportMaybe its is 'parabonoma'
21 March 2012, to 24 July 2012
this maps to the present moment.
that is the corridor in Solid Blue/yellow dividing bilaterally the parabolas engendered by the break out of life. Will it survive. . . Cliff hanger
Is this phenomena, math? Weird chaos ripples?
DB, One Big Bounce. ? . 4hr . this DB Model is well developed
Experimental. Kraft .
These New Blue / Grey set has emerged from the slightest vote of life for the Jag . one has to look at 3 min scale. but its there. If this , compliantly rises to emerge over previous bounce highs. ( with extreme along the upper 'abola? . Solid yellow is a long term curve. I was shocked to find it. Solid red is the floor. Tats the bargain, Volks. slow growth, out of Zombie B. state ?

Fiboracle Introduction (Part 2)1. An asymmetric bullish/bearish pennant is drawn using ascending and descending curved trend lines with a minimum of three price action touche points per line. The direction is determined by the previous trend.
2. The angle tool is applied from the earliest two trend touch points, beginning at the earliest touch point.
3. A trend-based Fibonacci retracement triangle is drawn starting from the earliest trend touch point and ending at the earliest touch point of the opposite trend line.
4. Based on the degree, of the earlier defined angle, the appropriate (and secret) levels are selected for the fibonacci retracement; two levels for stop-loss and two levels for take-profit. The closest stop-loss level to the current price level is the top priority stop-loss. Though the secondary stop-loss level is often chosen for some markets such as FX and some equities in order to account for seldom unexpected resistance breaks. The greater target level is the top priority, and where majority of the shares are sold, though some may choose to close part of the position at the first target level or set it to be the stop-loss once price exceeds it. Entries should be laddered in around the levels closest of the yellow line.
This trading strategy can be applied to any market and time frame, and positions most often garner the greatest risk-to-reward ratio with the highest success rate. What more can you ask for?
