DELL eyes on $116.10: Golden Genesis fib will determine TrendDELL has been a sleepy stock with mixed earnings.
Now testing a proven Golden Genesis at $116.01
Look for a Break-and-Retest to start an Uptrend.
.
See "Related Publications" for other plots ---------------------->>>>>>>
This one in particular is caught the BOTTOM exaclty:
===================================================
.
1DELL trade ideas

Dell, bullish, ascending triangleNYSE:DELL looks ready to go
4 weeks of tight price action with higher lows
AI infra has been hot and dell is a key player
nuff said

DELL : Bullish after correctionwithin a 1 or so I expect a Pull back correction (1-2 weeks) than a continuation of Dells bullish momentum , May be an opportunity to add to you position. There no telling exactly how far down a larger scale wave -2 correction may go , ( Best case 105/ Worst case 85 ), . Need to wait and analyze the wave structure as it corrects.

DELL confirms bull flag breakoutDell has been in this bull flag for the past year; it finally broke out and is now eyeing new all-time highs. I'm waiting to see if Dell comes down to test the top of the channel as support, if so that would be a great entry opportunity.

DELL: Bullish Channel Breakout Targeting Prior HighsOverview:
Dell Technologies ( NYSE:DELL ) has exhibited significant price action over the past year. After a strong uptrend culminating in a multi-month high around the Target 145 zone in late 2024, the stock underwent a substantial correction. However, since its April lows, NYSE:DELL has initiated a robust recovery within a well-defined ascending channel, demonstrating clear bullish momentum.
Key Price Action & Patterns:
Prior Uptrend & All-Time High Test (August - December 2024): The initial phase of the chart shows NYSE:DELL in a strong ascending channel, culminating in a peak within the Target 145 zone. This zone represents a significant historical resistance level, being the prior peak before the subsequent decline.
Corrective Phase & Bearish Channel (December 2024 - April): Following the rejection at the 145 zone, NYSE:DELL entered a steep downtrend, breaking below key support levels and declining into April.
Bullish Reversal & Ascending Channel (April - Present): From its April lows, NYSE:DELL has embarked on a powerful recovery, forming a clear ascending channel. This pattern is characterized by a series of higher highs and higher lows, indicating sustained buying pressure.
Critical Levels & Current Status:
105 (Lower Teal Zone): This level has acted as a crucial support point within the current ascending channel, marking a significant higher low in the ongoing recovery phase. It represents a strong demand zone.
115 (White Line): This horizontal line served as an intermediate resistance level in late May/early June before being decisively breached. It now technically functions as immediate support, offering a potential retest level on any pullback within the current uptrend.
125 (Current Teal Zone): This is a highly significant pivot zone. It previously acted as major support in late 2024 before the breakdown and later as resistance during the early stages of the recovery. The recent price action shows a decisive breakout above this 125-resistance zone, signifying strong bullish conviction.
Target 145 (Upper Teal Zone): As the prior multi-month high, this zone remains the primary overhead resistance and potential upside target following the breakout from the 125 level. The dotted line projection illustrates a common post-breakout scenario, where price might retest the breakout level (125, now as support) before potentially moving towards the 145 targets.
Technical Outlook:
The recent breakout above the 125 resistance is a strong technical development, confirming the strength of the current uptrend within the ascending channel. This move suggests that buyers are in control and are aiming for higher price levels. The immediate focus shifts to the validation of the 125 level as new support, followed by a potential advance towards the Target 145 zone. Continued price action within the ascending channel and above 115 would reinforce the bullish bias.
Disclaimer:
The information provided in this chart is for educational and informational purposes only and should not be considered as investment advice. Trading and investing involve substantial risk and are not suitable for every investor. You should carefully consider your financial situation and consult with a financial advisor before making any investment decisions. The creator of this chart does not guarantee any specific outcome or profit and is not responsible for any losses incurred as a result of using this information. Past performance is not indicative of future results. Use this information at your own risk. This chart has been created for my own improvement in Trading and Investment Analysis. Please do your own analysis before any investments.

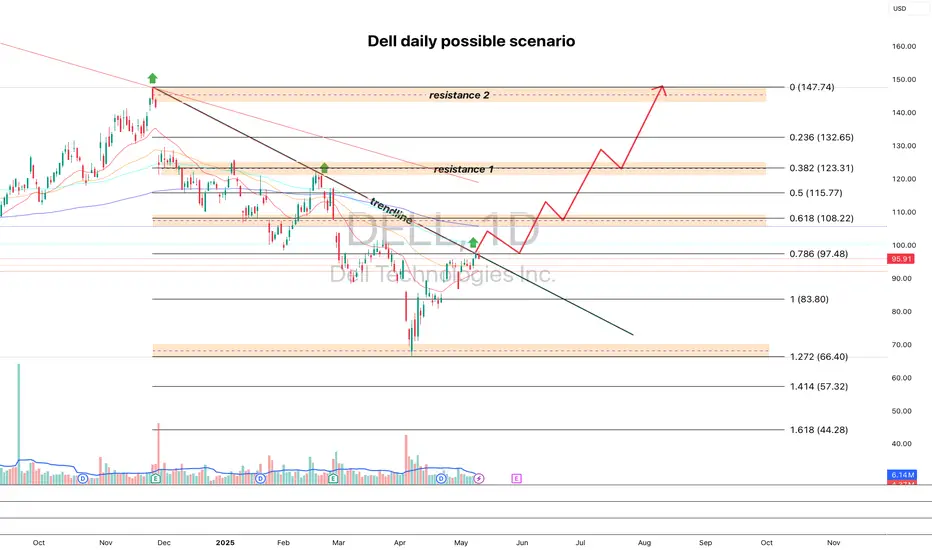
DELL looks good for pump dailyI'm watching DELL for a breakout of the trendline and a cross above the 100 MA — targeting a move toward 108.22, followed by a retest of the breakout and further upside targets at 123.31 and 147.74.
Fundamentally, the company looks strong, and the next earnings report is expected on May 29.
If you like the analysis, hit that rocket 🚀
What could be the target for DELL?DELL can easily go up +25% in the next 2 months and 50% in the next 6 months.

Dell on WatchLong or short position could be setting up.
I see two potential patterns forming.
1. Long: Inverse Head and Shoulders (orange)
2. Short: Diamond top (purple)
Price also bounced off Daily 20 EMA

Dell- Upside momentum is backNYSE:DELL . Despite weaker earning expectations, Dell managed to stay afloat and consolidate into a potential bullish flag. We think that there is still short-term upside expectation as the doji candle managed to stay above the 9-period conversion line. Furthermore, based on the Elliott wave theory, the stock is likely to end its ABC corrective three wave structure as momentum is back to the upside and stock has broken above the intermediate downtrend line of wave B to wave C.
Meanwhile, MACD is showing long-term positive momentum, along with mid-term stochastic.
Target wise we expect Dell to reach 140.00 region to fill the bearish gap. Any correction we will be looking at 100.00 psychological support to stage a rebound.

DELL Stock Price Analysis Ahead of Earnings ReleaseDELL Stock Price Analysis Ahead of Earnings Release
In addition to Nvidia’s (NVDA) quarterly report, this week financial market participants are also closely watching Dell Technologies’ (DELL) earnings release, scheduled for Thursday, 29 May, after the close of the trading session.
According to analysts cited by the media:
→ the company’s revenue is expected to come in at $23.18 billion (compared to $22.24 billion in the same period last year, and $23.9 billion in the previous quarter);
→ particular attention will be paid to Dell’s business segment focused on manufacturing servers for AI applications.
Notably, DELL’s price chart shares several similarities with the NVDA chart we analysed yesterday.
Technical Analysis of DELL’s Share Price
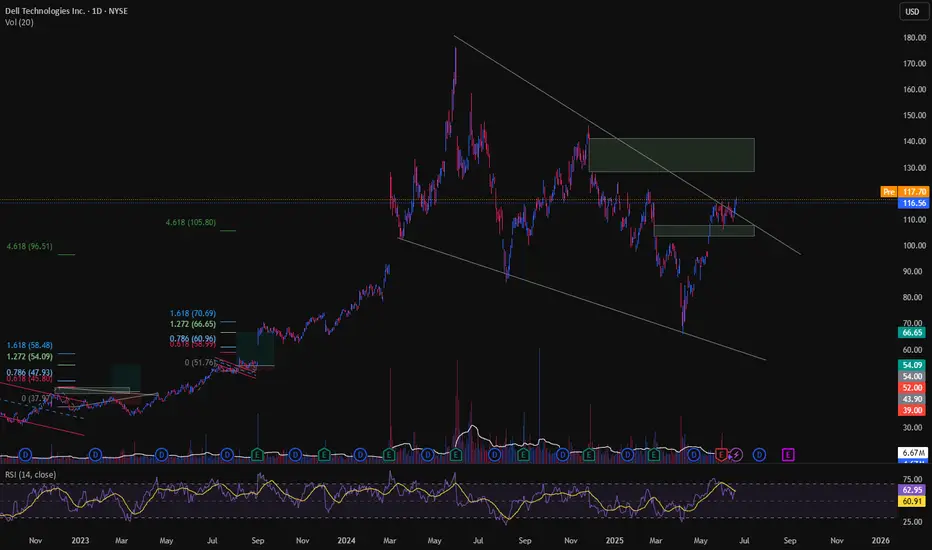
Price movements have formed a downward channel (shown in red) that has remained valid since 2024. In a broader context, it resembles a bullish flag pattern, which typically signals the potential continuation of an uptrend — a scenario that seems increasingly likely given the following:
→ the DELL’s price is currently near the upper boundary of the channel;
→ the May price rally suggests strong demand for DELL shares. Note the confident breakout above the psychologically significant $100 level (highlighted by the arrow), accompanied by a bullish gap and a series of rising candlesticks.
It is possible that the upcoming earnings report will act as a catalyst, enabling the bulls to gather momentum and attempt a breakout from the prevailing downward channel.
This article represents the opinion of the Companies operating under the FXOpen brand only. It is not to be construed as an offer, solicitation, or recommendation with respect to products and services provided by the Companies operating under the FXOpen brand, nor is it to be considered financial advice.

Dell going strong after big dipDell going strong after big dip, after creating head and shoulder, Dell going to close the chart pattern with target 127$, to the target we have the strong Weekly resistance 115$ to break, then the strong high 121$, a short term trend line , and the all time high trend line, with good momentum we can test after this the last high before the dip 146$, Dell raised 75% in lest than 2 month and expect to reach 120$ from last dip in another 2 months,

DELL – Triple Breakout Targeting 135DELL is showing strong technical momentum after clearing three major resistance levels:
Ichimoku Cloud breakout at $100
EMA 200 breakout at $105
Trendline breakout at $113
With price now trading at $115, the structure suggests a potential move toward the $135 target zone.
Trade Plan:
Entry: $115.19 (current)
Stop Loss: Below $105 (under EMA 200 & cloud)
Target: $135
Risk–Reward: ~1:2
Volume and trend alignment support the bullish case. Watching for a daily close above the trendline to confirm breakout strength.
#DELL #Breakout #Ichimoku #EMA200 #TrendlineBreak #SwingTrade #TechStocks

Time to Buy DELL Technologies ?Looking at the weekly timeframe we can see Dell Technologies is in positive macro uptrend. Price Has respected the channel since the start of given data and continues to do so as well.
We can see price has touched the bottom of the channel once again and has confirmed a weekly green candle indicating heavy demand .
As we can see the most price has fallen In a heavy correction is no more than 56%.
Can we be seeing the beginning of a bottoming and the start of a new bulll trend ?

Dell broke the head and shoulders pattern.Dell broke the head and shoulders pattern. It's hitting FIB levels. Expect it to fill the gap to 107.29, then maybe hit 121.55. It's bullish short-term until it passes 121.55, then bullish medium-term.

DELL on the daily forming Inverse H&SDELL on the daily timeframe shows Inverse Head and Shoulders. If this were to play out then expecting the gap fill above to complete.
See chart for gap start and gap finish.
100 pysch level test would act as resistance. Once we clear that, gap fill completion is possible

$DELLIn just 3 days, NYSE:DELL is set to release its earnings report, and all eyes are on the numbers. What makes this even more interesting is their recent announcement of a massive $10 billion stock buyback expansion. This signals strong confidence from the company in its long-term value and could create bullish momentum if earnings align with expectations. Investors should keep a close watch, as this combination of financial results and aggressive buyback strategy could set the tone for a major move.

Dell Technologies (NYSE: $DELL) Stock Gains on Tariff ReliefDell Technologies Inc. (NYSE: NYSE:DELL ) rose sharply on Monday following the Trump administration’s temporary suspension of tariffs on smartphones, computers, and other electronics. The updated guidance from U.S. Customs and Border Protection late Friday excluded these items from the latest round of reciprocal tariffs, which had raised concerns among tech manufacturers.
Dell shares gained 4%, closing at $85.19, up $3.26 on the day, with a trading volume of 12.35 million shares. The stock had opened at $89.29 and reached a low of $84.01 during the session. The tariff pause, though potentially temporary, has eased pressure on companies that heavily rely on global supply chains. Dell, which produces most of its hardware outside the United States, stands to benefit significantly from the exemption.
JPMorgan analysts commented that the exemption highlights the strategic importance of electronics to American consumers and the economic weight of companies like Dell and Apple. While Apple is accelerating its manufacturing diversification into countries like India and Vietnam, Dell continues to leverage international production capacity to maintain its competitiveness.
Technical Analysis
From a technical perspective, DELL is currently trading within a descending channel that started from its all-time high of $179.70. The recent bounce from a support zone indicates potential short-term support. The price action suggests two likely scenarios: a continued climb toward the upper boundary of the channel near $110, or a pullback to test lower levels around $42, aligned with the bottom of the channel.
The 200-day moving average (86.18) and 100-day (116.72)currently sit above the price, indicating a bearish medium-term trend. However, if DELL holds support around $85.11 and gains momentum, it could challenge the mid-channel resistance and eventually attempt a breakout.


DELL watch $70 then 67: Supports for a possible dead-cat bounce DELL crashing more than others from tariff-tantrum.
Pierced a minor support on its way to a major support.
Should get a dead-cat bounce to major resistance soon.
$ 70.27 - 70.90 is the minor support to watch.
$ 66.78 - 67.35 is the major Support below.k
$ 76.64 - 77.15 is now a major resistance above.
================================================

Call me crazy...but I'm scaling into DELL 2027 Calls💡Call me crazy… but I’m scaling into DELL 2027 calls.
Strike: $85
Cost: ~$20
Expiration: December 2027
Chart target? North of $230.
(Yes. You read that right.)
The market just served up a gift — and I’m grabbing it with both hands. Dell just dropped nearly 20% on tariff fears and algorithmic panic. But the long-term AI/data center megatrend is still intact.
This is not your grandma’s PC company anymore.
Sometimes you gotta step into the fire when no one else will.
> Risk? Defined.
> Reward? 5x+ potential.
> Time? Plenty of it.
If this thing even comes close to previous growth cycles…
we’ll be glad we were “crazy.”
#DELL #OptionsStrategy #LongTermConviction #TheAccidentalRetiree #BuyFear #SmartMoneyPlays #AI #TechStocks

DELL Buy Scenario with helping 0.618 retracement - price moved up recently
- now retraced to the 0.618 fib
- my calendar says: 31th or march is a strong starting point for a high properbility upmove
maybe you wanna find your entry soon on some criteria you know, understand and learnt to trade?
let ' s discuss and feel free to hit that rocket symbol and leave a comment. this way it is more fun.
cheers!

Dell Might Have Broken Another Bearish FlagDell Technologies has been crumbling since November, and some traders may see further downside risk.
The first pattern on today’s chart is the series of higher lows between March 10 and 25. The computer maker slipped below the rising trendline this week, which may be viewed as a potential bear-flag breakdown. (Similar moves recently resolved to the downside.)
Next, stochastics are dipping from an overbought condition. Similar turns, like on January 7 and February 21, marked tops. (See the yellow arrows in lower study.)
Third, prices are stalling at the 21-day exponential moving average (EMA). The 8-day EMA is also below the 21-day EMA. That’s potentially consistent with a short-term downtrend.
Fourth, the 50-day simple moving average (SMA) had a “death cross” below the 200-day SMA in January. That’s potentially consistent with a long-term downtrend.
Finally, DELL recently peaked near the September low of $101.41. (See white arrows on the main chart.) Has old support become new resistance?
TradeStation has, for decades, advanced the trading industry, providing access to stocks, options and futures. If you're born to trade, we could be for you. See our Overview for more.
Past performance, whether actual or indicated by historical tests of strategies, is no guarantee of future performance or success. There is a possibility that you may sustain a loss equal to or greater than your entire investment regardless of which asset class you trade (equities, options or futures); therefore, you should not invest or risk money that you cannot afford to lose. Online trading is not suitable for all investors. View the document titled Characteristics and Risks of Standardized Options at www.TradeStation.com . Before trading any asset class, customers must read the relevant risk disclosure statements on www.TradeStation.com . System access and trade placement and execution may be delayed or fail due to market volatility and volume, quote delays, system and software errors, Internet traffic, outages and other factors.
Securities and futures trading is offered to self-directed customers by TradeStation Securities, Inc., a broker-dealer registered with the Securities and Exchange Commission and a futures commission merchant licensed with the Commodity Futures Trading Commission). TradeStation Securities is a member of the Financial Industry Regulatory Authority, the National Futures Association, and a number of exchanges.
TradeStation Securities, Inc. and TradeStation Technologies, Inc. are each wholly owned subsidiaries of TradeStation Group, Inc., both operating, and providing products and services, under the TradeStation brand and trademark. When applying for, or purchasing, accounts, subscriptions, products and services, it is important that you know which company you will be dealing with. Visit www.TradeStation.com for further important information explaining what this means.
