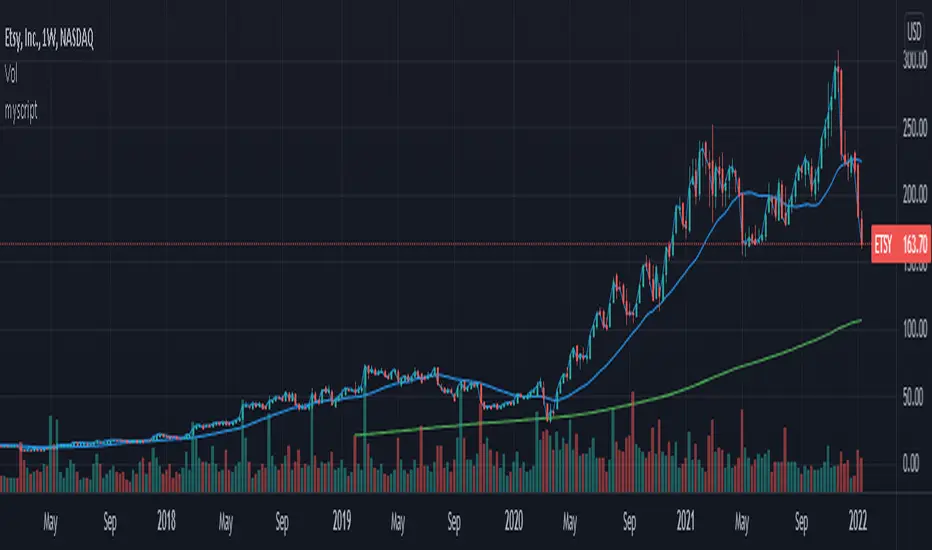
ETSY: Looks Promising in the Long Term but...It is worth waiting a little before putting your money in NASDAQ:ETSY . I am bearish on NASDAQ and it could pull down ETSY with itself.
(You can check my comments on NASDAQ in my profile.)
However, if you are a long-term investor with diamond hands, here looks like another good buy zone in the long term if you can bear a ~15% drop.
I am on the waiting side.
1ETSY trade ideas

ETSY - Complete ReversalA broadening wedge or megaphone is present but it has a long way to reach the top of it. Its not impossible though, as shown with the bars pattern tool in green.
I expect a W like reversal at the bottom trend line and recovery up within the megaphone.
Daily chart.

ETSY potentially forming a broadening formationEtsy, the popular online marketplace, has recently shown promising technical indicators that could lead to a significant upside move. A bullish MA crossover and the formation of a potential broadening pattern have caught my attention.
Etsy's price chart reveals a bullish MA cross, with the shorter-term MA surpassing the longer-term MA. This suggests a potential shift in the stock's trend and the possibility of further upward movement. Additionally, a potential broadening formation, characterized by progressively wider price swings, has emerged. This pattern indicates increased volatility.
Etsy's bullish MA cross and the potential broadening formation indicate the potential for an upside move in the stock.

ETSY - Wheel Strategy - Sell PutMACD showing signs of reversal to negative
RSI at 56 - nothing to note here
Inverse head and shoulders looks to be forming. Could be good to get in around $90.
Looking at selling the $90 PUT

Bullish Alert : ETSYGreat bullish alert on NASDAQ:ETSY on the daily chart.
Price action is not yet positive and over the long term it doesn't look good.
Lower time frames are already showing a full combo.

$ETSY - Could be heading towards prior supportNASDAQ:ETSY Looking like it can get to $74 - $70 area which could be interesting area to play the bounce. $70 area had previously provided support. Watching for now.

$ETSY Swing TradeEtsy is at the early stages of a failed breakdown and is showing bullish divergence. A close above $98.11 will confirm this and will mark a great entry. Given the low cost of option calls for next month I entered a few $120 strike for $0.15. Looking forward to this trade. Low risk, high reward.

bearish on etsy?bearish on Etsy?
High growth tech under pressure, purely based on technicals this is heading to 100 or somewhere in that range.
Tactic: Invest at first profitable quarter. Case study: ETSYTactic: Invest at first profitable quarter and hold.
Case study: ETSY pre-covid chart. Post covid high of like $300 is too silly to show.
Note:
#1. Apr'15. IPO madness of $32 died down to $8 after about 6 months.
#2. Mar'16First profitable quarter at $8, then profitability backslid but that was the new price low. If buying and holding at point #2 until point #4, total gain of 775% in 3 years. Annualized 106%.
#3. Jun'17After 14 months until the next profitable quarter, price was $15 a gain of nearly 100%. Despite that increase, that would be the new low.
#4. Mar'19 price climbed to $70 with volatility.
MZ May 2023

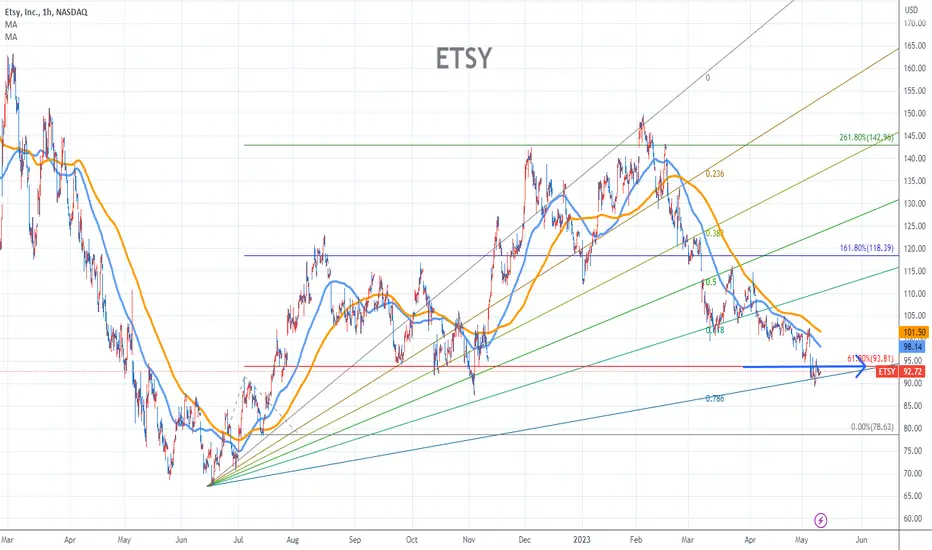
ETSY Stock Chart Fibonacci Analysis 050923Trading Idea
1) Find a FIBO slingshot
2) Check FIBO 61.80% level
3) Entry Point > 94/61.80%
CypherEarnings 5-3-23 AMC.
Cypher noted for now unless the 4th leg goes much further to the downside. The 4th leg is dashed as I am not sure it is complete.
Peak 2 is higher than peak 1. Leg 2 completed at the .618 of the first leg up. It is an M pattern.
This is not a long entry level although there was a attempt, but an throwback sent this back to support.
Etsy missed earning the last 2 quarters.
No recommendation.
possible stop under 99.23
IT APPEARS EARNINGS WILL BREAK OR MAKE THIS ONE.

ETSY - UpdateYellow count is primary with blue just behind... white has almost left the building but is still holding passes for divergences to arise. Daily bearish engulfing spells trouble and if a new low is found... don't fight the trend. GLTA!

Won't holdWe have a double top within another double top. This is very bearish, if price bounces off the weak support to test the resistance again I would add to my short position.

MOMO to $116?$ETSY really setting up here and can fly.
I think $SPY can hit 410 before cooling and in that move $ESTY can move a bit harder and hit a nice price.
Good luck

Who doesnt want to see a higher high?Looking to take up a swing position into ETSY. I dont know that this price target will be fully met. it is a fib retracement level that was left hanging, and it appears a leg up could be in order. Assuming we dont lose support as it sits at a key level and also at near the 200EMA.

ETSY LongI would wait for FOMC before any long trades but here is a stock to watch for swing long vs last week's low.

ETSY - 3 DazeThis market can be dizzy and confusing, but candles can light the way. ETSY has been on a rollercoaster of a ride as of late, but over the past few days, it has begun to change its normal mode of transportation. I'm not suggesting it will board a rocket ship any time soon, maybe never, but it does seem to have gathered up enough scratch over the past few months to ride in style for a lil while. The road map is there, and this crafty thing likes a good stencil. 3 day candle closes tomorrow, and if it remains as is (bullish engulfing) or stronger, then the beginnings of a cruise to 180 town can become the primary plan; lose this bullish engulfing look by tomorrow's close and vacation time could be canceled. GLTA!

ETSY - Last ExitSometimes we get distracted by shiny objects along the way; ETSY has definitely been privy to recently falling astray. If it is to find some legs to get long, then something like this might help guide a careful observer along. GLTA!

ETSY - Fun with ART and LINESLikely ETSY is working on a B wave up into the natural area of a B wave (50% retracement of the move down). If so, then the 5 waves down should be accompanied by another 5 waves down (yellow line). The magnitude will likely not be the same as this A wave down (labeled (1-5)), but I expect the duration to be similar. Invalidation would take a lot, but most logical would be a move below the white B. GLTA!

What if Citron is right?Current market cap = 14.889b
FY 22 sales = $2.57b
Price to Sales ratio = 5.80
Etsy has been accused by citron research of selling counterfeit products look at the below tweet for their reasoning twitter.com
Now here are the 3 big questions to be answered
1. Will ETSY face legal problems in removing all counterfeit products?
2. What % of their 2.57b revenue comes from that products?
3. How much will they have to cut on their ads spend once they deal with this potential problem? how will that affect their sales numbers in the future?
I don't think Mr market likes companies in that kind of legal trouble!
$12 market price = $1.48b market cap ;)
P/S = 0.5-1 ???
My gain is your loss ;) it's a zero-sum game after all.
Do your own research!
Look first / Then Leap

ETSY Options Ahead of Earnings If you haven`t sold ETSY after the disappointing forecast and bought the price target:
Then you should know that looking at the ETSY options chain ahead of earnings , I would buy the $128 strike price Puts with
2023-2-24 expiration date for about
$6.90 premium.
If the options turn out to be profitable Before the earnings release, I would sell at least 50%.
Looking forward to read your opinion about it.

Ascending Triangle formation in ETSY Hi Traders & Investors,
I am excited to share my next script. Its Etsy! The script has formed a nice ascending triangle after a decent correction.
Ascending triangle formation is a nice base formation pattern which can give good entry points and the risk rewards are favourable.
This pattern has a high success rate and can be considered before the breakout or during the breakout as well.
Based on my analysis on this the entry can be taken in range of 135-145. Stop loss below 129 daily closing basis for short swing and 110 in weekly closing basis.
Target in ascending triangle is the height of the triangle. Looking at red line this comes at 300+ levels.
This setup can be placed by positional as well as medium term 6-8 months.

Value concept: how to visualize on any timeframe or instrumentThis idea and trading concept is based on the Bollinger bands and keltner channel
The areas this tool easily identifies with visual points of interest, allows you to see where there is market agreement on price and give solid support points when price returns to these areas.
I have put together a mashup of indicators to easily recognize these area and build your strategy against.
This video supports this concept.
www.youtube.com
