GE is testing the resistance againNYSE:GE is about to test the resistance line at ~$14.50
from MACD and volume it doesn't look like there is a lot of momentum to break through.
I see this as bearish signals.
1GE trade ideas

GE is prime for an upward moveThere's no reason not to own NYSE:GE right now. Solid company backed by solid technicals.
From current level, looking $20 - $22 medium-term target and a long-term target of $28.

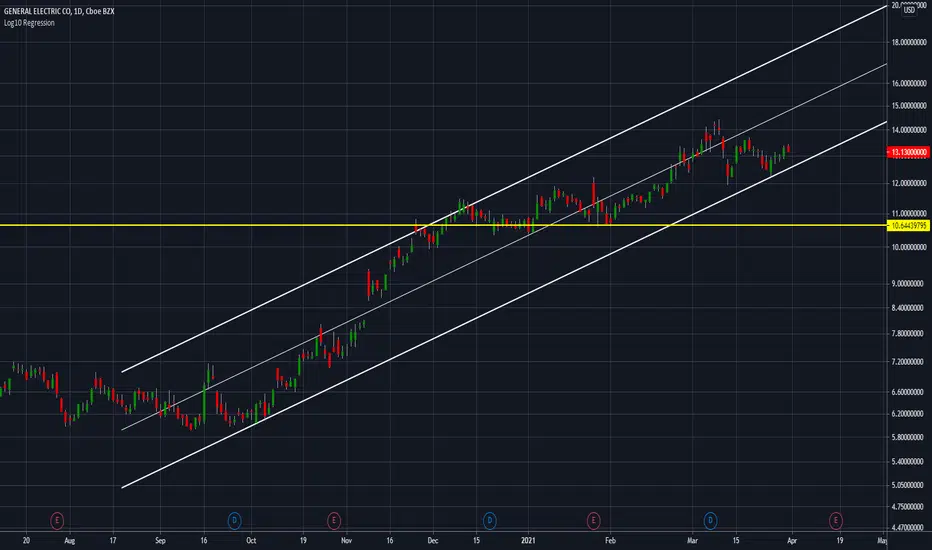
GE 6 Month TrendAs shown in the chart, over the last six months since mid September 2020, GE has been trading on an uptrend that is on pace with it's current two week uptrend. This longer period uptrend conveys that the shorter period uptrend is strong because it is historically backed. If the trend continues, It is probable that GE could make a move by the end of the year to a historical resistance line at $18.86. In the chart I've also included Moving Average lines including the 10 day, 30 day, and 50 day to show that since the uptrend began, the 30 day MA has moved back above the 50 day and below the 10 day indicating a bullish trend in the short term. The current uptrend also shows multiple bounces off of the 10 day MA acting as a line of support for the trend, even furthering my bullish view on the stock price.

GE Two Week TrendsThis chart shows the history of GE's stock prices over the last couple months. Recently, GE has began an uptrend after a bounce off of the VWAP curve. The VWAP curve has proven to be a strong line of support for GE historically. Over the course of the last couple weeks, GE is in an uptrend. However, GE is trading at $13.60 as of close on Friday, April 9th 2021. The chart shows that historically, there has been a strong line of support/resistance around this price (approximately $13.60). If this line of resistance holds, GE will likely see a bounce to the downside in the short term and the line of support for GE's current uptrend will be retested for a third time (around $13.40). If the uptrend holds, it is probable that there will be a run to the upside surpassing it's current price and potentially rising to about $13.90-$14.00 in the short term where it will reach another historical line of resistance/support.


- GE - $15 is in the horizonRide the wave, watch for any breaks in the trend lines you set.
Like and Follow for more!
Thanks


$GE Ascending Channel#GE has been making some solid moves. Ascending channel with lots of room to increase.

$GE 2021-APR-01Let's see if $GE rallies in the days leading into the next earnings period. This is definitely one to watch!

GE: Some patterns you should be aware of!Hello traders and investors! Let’s talk about GE again!
As we discussed in our last study, GE reacted quickly and denied the bearish pattern seen in the hourly chart of an Island Reversal , and it filled its gap. As usual, we have some congestion now, but only after it stressed the 21 ema in the daily chart. Also, if you missed my previous analysis on GE, the link to it is below this post, as usual.
Now, in the daily chart, we have an idea of a H&S chart pattern, but it wasn’t triggered yet. In fact, if GE denies this pattern and defeats the last “shoulder” by trading above its high, probably we’ll see a continuation of the bullish momentum.
Today, we had a classic Bullish Engulfing candlestick pattern, which has a good chance of working as a reversal in the next few days.
Now, to the weekly chart:
It is natural to see some exhaustion signs, after all, GE just hit an important resistance level at the green line (the high before the Covid’s crash), and it is far from the 21 ema.
We had a Bearish Engulfing 2 weeks ago, which wasn’t triggered as well, so, GE is just moving sideways, and this is a nice sign, as crazy as this sounds . When a stock goes up too fast, it must rest a little bit, but when the stock rests while moving sideways, it means the buy force is still present, then we have a sideways correction – or as I like to call, Time Correction .
So, let’s not be frustrated or surprised if GE keeps trading sideways until the 21 ema hits the price. Meanwhile, let’s keep studying it, and if you liked this analysis, remember to follow me to keep in touch with my daily studies, and support this idea with your like if you’ve read this far!
Thank you!

GE speculativeHello everyone, today, I think, is time to talk about General Electric Company.
I can say, that from vision of fundamental analysis it is danger play. Company had a lot of problems for last 3-4 years.
Bad news are:
- we have really bad condition in financial stability, so-so valuation rank (not good and not bad)
- return don't cover debts (but, maybe, it is temporarely)
- overevaluated and price is higher even then FCF
- Company is more volatile because of fundamental problems and is less "resistant" to the news, conferences.
Good news are:
- Finally, company has good financial results, they are best in this industry
- New management took course on decreasing of debts
- Optimization of business cause lesser inventories and decreasing non-profitable parts of company.
- Gurus of Fundamental investing use GE as middle/short term asset, so it is possible to use it too. In september 2020 if You will invest in GE, at the 01/01/2021 you will have 100% of profit.
But I recomend to be careful, look for oportunities and chances. Or if You are ready to play in speculations and risk - don't risk too much, think about money management.
As usual - that is only opinion, I don't give recomendations. Any investing or speculations is risky and can cause losses. Past success don't guarant success in the future.

Head and shoulder in 30 min chart!keep it on your watchlist! crossing below 13 makes it a good choice to buy put 13 march 26!
I always try to present the charts in a simple comprehensive format to prevent any confusion.
This is just my technical view, neither a fundamental comment nor a recommendation to trade..!
Please review my track record and calculate the odds for yourself..!
You’re likes and comments encourage me to continue this.
Stay tuned great live stream and quality content videos coming soon..!
Option trading exposes you to a high risk of losing your capital, never invested in any idea more than what you can afford to lose(5%).

GE UpdateI like Larry Culp as a CEO. I like the recent moves they've been making:
1. GE Healthcare launched a new wireless hand held ultrasound named "Vscan Air." GE Healthcare estimates that the market for hand held ultrasounds will grow as big as $1billioin in the next decade and they want to capture 30% of market buy 2025! This bad baby connects to a smartphone app and is entirely wireless. The device can also be used by traines health-care providers to quickly evaluate blood flow, gallbladder disease and assess and monitor Covid-19 through a lung exam.
2. Aercap merged with GE's jet leasing unit. Aercap agreed to pay $25 billion in cash and $6.7 billion in shares. GE gets $24 billion cash I believe towards their current $50 billion dollar GE Capital debt. This isn't the best news, but it shows that my boy Larry is on to something.
Details in photo!

GE - Short-term & Long-termHello traders !
First of all, this is not a professional analysis nor an advice of any kind. I’m only sharing my thoughts.
General Electric is at strategic resistance/support level, which goes back to Jun 2010, at 13.27.
For the short-term, GE is showing bearish signs as the weekly candle opened and closed below the strategic resistance (Yellow line) + the daily MACD has already crossed below its signal.
The way I see it, there are two possible scenarios:
1. It tests the SMA200, at around $12.25, before it bounces back at around $16.
2. If SMA200 failed to act as a support level, then the next support level would be the green trendline at around $11.
Inconclusion, General Electric is bearish for the next couple of weeks and Bullish for the long-term.
(If you find this beneficial, don’t forget to LIKE).
Happy trading!

$ge Bullish update Long GE has some amazing work to do.... the next 6 months should be interesting as we watch the company re-esyablish itsself has the leading global giant

$GE with a Neutral outlook following its earnings #Stocks The PEAD projected a Neutral outlook for $GE after a Positive over reaction following its earnings release placing the stock in drift B
If you would like to see the Drift for another stock please message us. Also click on the Like Button if this was useful and follow us or join us.

GE bullishThe trendline is still holding trend to bullish behavior, next resistance level is at $15 from 2018.

General Electric maybe laterGeneral Electric was one of the greater loosers last week.
Searching a bottom is now possible and maybe watched.
One possibility is trend channel or support below the channel will help the stock price to not fall below.
To be secure, if wait till the resistance is confirmed...

GE; bearish engulfing on Weekly resistanceanceGE has had a good run up since it bottom out at about $6. With lots of news about EV, it seems GE can go higher. But before that, it is always healthy to have some form a retracement.
Based on the 1H chart, a good place to start shorting is between $13-13.25
Target profit 1 is $10.50 area/ 20 MA
Target profit 2 is $8.50 area.
Disclaimer: I'm not giving any trading and investing advice. I'm just sharing my chart observations.
If you have any symbols that you'd like me to analyze, feel free to drop me a comment.
Thanks!

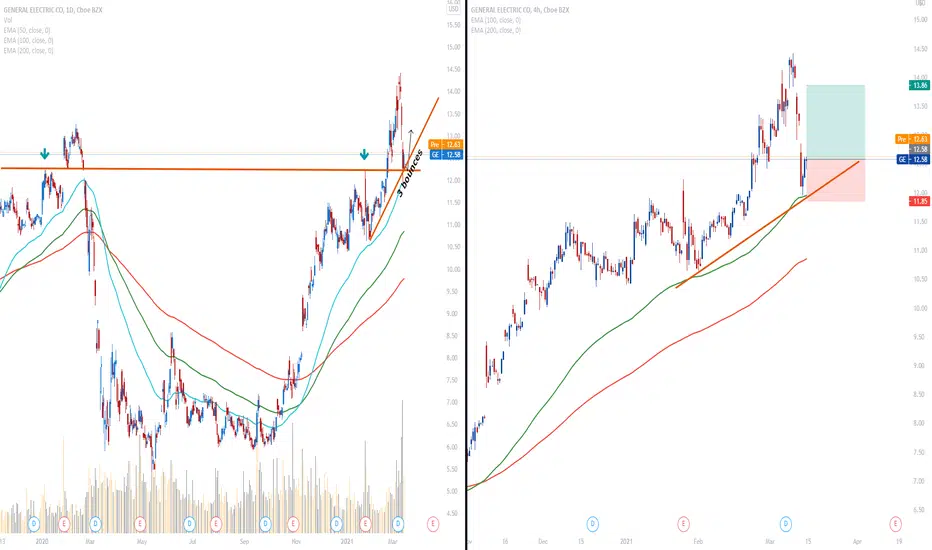
GE Signals Long
GE had dropped by 14% last week from Tuesday to Thursday experiencing its largest fall-off in the past 11 months. While on Friday, GE rebounded and added 2.53% and closed the trading session at $12.58.
And looking to recover some of last week's losses, GE is up another 1.2% to $12.71/share in premarket trade today. And last week, Deutsche Bank raised its price target on GE to $14 from $13.
GE is trimming its losses to get back higher after testing the lower boundary of the upward sloping channel. And it's also clear the 100 EMA has been so important over the last period acting as a strong support.
Traders may consider trading long positions as long as the price remains well above $12 so we can see prices at $13.40 as the next bullish objective to target.
The bullish break of this resistance would revive more bullish momentum, So the he bullish movement could then continue towards the next resistance located at $14.50.

3 Moving Average at Daily and H4 charts
Opportunity to buy on the daily and the four-hour frameworks supported by the averages 50 100 200
General Electric has had a tough week to say the least. First, it announced a deal to combine GECAS, its aircraft leasing arm, to AerCap Holdings (NYSE:AER) in a $30 billion agreement.