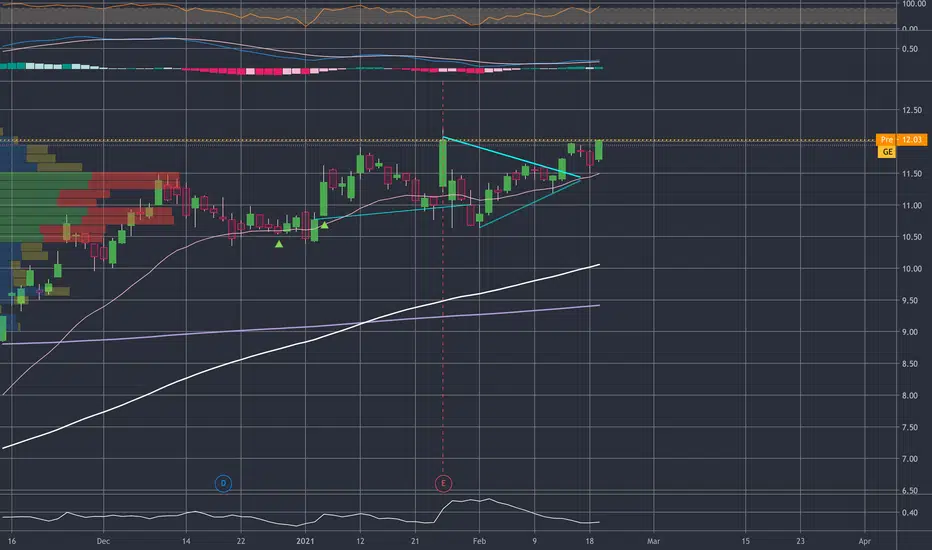
GE Bull Flag, comfortable with rise to 14.8-16GE has put in a daily bull flag, with the Monday (2/22) break above the trend and the Tuesday (2/23) retouch of the line and return above the extension is valid as of right now.
You could say conservatively that the pole of the run goes from 7-11 making it a $4 dollar extension. With current price at around 12.8 we could see a run to 14.8 and 16 respectively.
Have a good trading week.
1GE trade ideas

GE Long
William Alligator : the stock is in a bullish position because the candle sticks are above the Teeth, Lips and Jaw. The lines are “eating with an open mouth” and this show that the stock is in a strong uptrend.
MACD : the line is above the signal line, this is a bullish confirmation. Moreover, the green vertical bars indicate that the price is increasing.
ADX : the line is 47.02, so the stock is in a strong uptrend.
Candlestick patterns : there are two bearish engulfing before three white soldiers which are a bullish confirmation.
Overall : it can be interesting to take a buy position on this stock because all the indicators indicate that the price is increasing and will continue like that. Moreover, the stock is in a strong uptrend. Entry price is higher than the current price for assurance.


$GE - longGot my limit order in.
It held $12 on the close so its time to get in and hold to $20 / share

GE Rising Flag Pattern!Ge has developed a bearish flag pattern. It includes a pole and a rising channel. Secondly, in my illustration I marked a possible exhaustion gap that occurred right when the bearish pattern started. This is it, but make sure to watch and see if it breaks below the support line. Please like and follow, thanks!

General Electric looks bullish for 2021. Possible 100% gain. General Electric looks bullish for 2021. Possible 100% gain. Looks like a weekly breakout for GE, targeting a possible 100% plus gain. NYSE:GE NYSE:GE

Mr. West Weekly notes Report no. 10Trending up: CAN, REKR, MTSL, CSX, XELA, JETS, BOTZ, HERO, MVIS, ROKT, RAIL, AESE, UA, SYN, ZNGA,
Trending down: CRON, PBI, ACB
Consolidating: WPRT, GE, NNDM, AMC, JBLU, DENN, NCLH, MICT, NAKD,
Today's notes will reflect the number of up trending, trending down and consolidating stocks that are on the List. Majority of the stock list has shown great growth over the past month. CAN has grown based off the number of volume that bitcoin is fluctuating through. The airline industry is starting to grow slightly, but many corporate businesses are may not execute flight travel due to virtual business meetings becoming the normal routine. On the consolidating list, some stock have shown a few promising set ups for possible swing trades in NCLH, MICT, NAKD and GE.
Based on the weather conditions in the U.S. and the server ice storms along the Eastern coast, many sales went up due to increase sales with GE heating products and trying to keep warm during cold times.


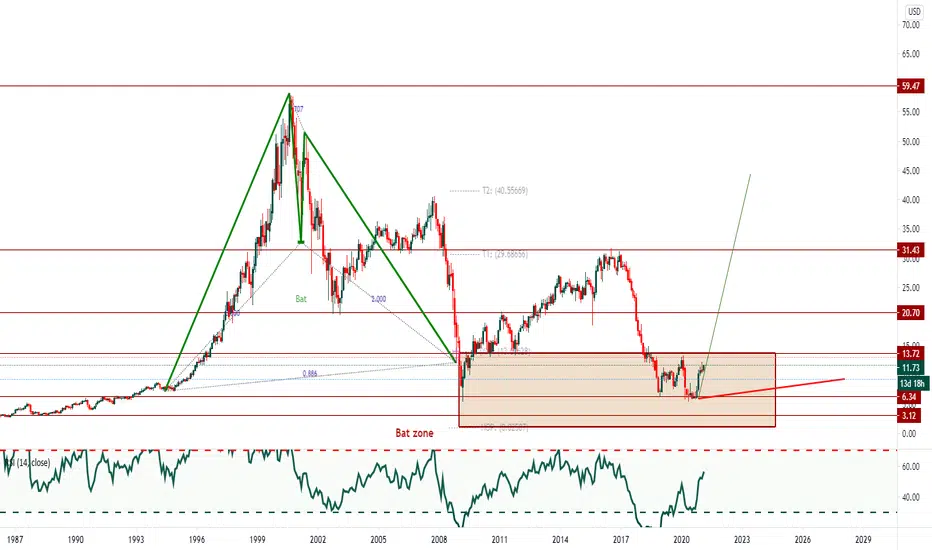
GE MONTHLY BULLISH BAT
price need to follow Green Trend line & hit target
If price Breaks Red Trend line is where EXIT before SL hits
POTENTIAL BUY
GE cup handle chart w/ promising shoot upI am by far no expert, just having fun charting and seeing patterns... Pre March Covid crash, GE was in an upstream, which got halted by the crisis, rattling it down stream towards the bottom of the cup, where it traded sideways, until about late Sept/Oct where the two straight lines intersect, whence an upstream trend started until about early December where a handle panorama started to form, with a lot of consolidation, where perhaps many investors were taking profits from pre-Covid price ranges. In this current Handle zone (we are in the neon small green line now where today we saw a lot of momentum up pushing through resistances), GE seems to want to shoot up beyond the two parallel resistance lines, but I suspect more profit taking will take place, so I imagine some turbulence ahead there, as it consolidates, before piercing through its resistance lines, where price actually just recently hit on Earning Report day on 1/26. A seemingly classic Cup Handle form, which could work to our benefit. We shall see! The fundamentals of the DXY lower with the 10 Year Yield higher pointing to a stock market positive scenario, propped by high crude numbers, and Federal Bank supporting economic tools, feels to me like a ripe time to go LONG on GE. Good Luck trading!


$GE 2021-FEB-09𝐆𝐄 𝐬𝐦𝐚𝐬𝐡𝐞𝐬 𝐞𝐚𝐫𝐧𝐢𝐧𝐠𝐬 𝐞𝐬𝐭𝐢𝐦𝐚𝐭𝐞 - 𝐢𝐬 𝐢𝐭 𝐚 𝐬𝐞𝐜𝐫𝐞𝐭 𝐛𝐮𝐲?
The recent earnings showed the rolling 4Q EPS exceeded analyst expectations by 33%. HOWEVER , analysts were quite pessimistic on their estimates, and EPS is down year-on-year. So is this the first green shoots of a turn around; or just a last gasp for breath? I like GE for the long term. They have positioned themselves well for the emergence of new technologies in the renewables sector - while still being a major player in existing sectors such as aero.
In fact, one of the brighter spots for GE is their renewables business unit. With more initiatives coming out of the Biden White House; it seems that renewables will be a big focus over the next 4 years - and the upside could be very rewarding.

GE - The uptrend that doesn't stop (Update)
Ladies and Gentlemen this is simply a continuation of one of my previous ideas. I am just confirming to myself the fact that General Electric is still on an uptrend and seems unstoppable. Will keep updating.

short term target along one scenario any help would be greatly appreciated on what you think about this

GE Call Options Look PromisingI have moved into a long Call Option on GE . Their fundamentals have turned around significantly, they’ve cut debt, they will be good in a Biden America with their renewable energy sector and when their aviation sector picks up I think that they will see growth over the next few years.


Looking for a GE bull flag confirmationWe are looking for a bull flag confirmation on GE Daily Chart. We will be very careful for anything that is below $10.42 on the close.
So far we are just seeing a pull back to 10.82 and waiting for further confirmation.

GE downtrend prediction GE braced to form a Head & Shoulder pattern, which confirms my hypothesis the volume itself.
Volume has a downtrend between the left shoulder and the head which gives more accuracy to form the pattern.
The target price is 9.65$ which is a match between the distance from head to neckline and 38.2% Fibonacci level to the most recent uptrend wave.
MACD on WEEKLY TIMEFRAME shows saturation of buying power which also supports this hypothesis.

General Electric Stock AnalysisThe Idea is to go long but only if the 10.4 USD support level will not be broken. NYSE:GE

Short Idea for GE with a Pivot Point for Mid-Term (1 Year) TgtShorting GE until GAP closing near price 8.14 and opening longs from that area with a long term target around $18 per share.
