GE General Electric Company Options Ahead of EarningsIf you haven`t bought GE ahead of the previous earnings:
Then analyzing the options chain and the chart patterns of GE General Electric prior to the earnings report this week,
I would consider purchasing the 105usd strike price in the money Calls with
an expiration date of 2023-11-17,
for a premium of approximately $5.20.
If these options prove to be profitable prior to the earnings release, I would sell at least half of them.
Looking forward to read your opinion about it.
1GE trade ideas

General Electric (GE) Unit Wins Gas Turbine Order in ChinaGeneral Electric Company’s GE unit, GE Vernova’s Gas Power business, and Harbin Electric (“HE”) secured a contract from Chinese State Development & Investment Corp., Ltd. (“SDIC”) Jineng (Zhoushan) Gas Power Generation Co., Ltd. to deliver two gas turbines. These turbines will be installed in a new combined cycle power plant at the Zhoushan archipelago in Zhejiang Province, China.
GE Vernova is the combined operations of GE Digital, Renewable Energy and GE Power. Its Gas Power business includes General Electric’s gas lifecycle business (including Power Services and Gas Power Systems businesses).
Per the deal, GE will supply two units of 9HA.02 gas turbines to SDIC Zhoushan’s combined cycle plant, which is the first H-class gas-fired power generation project in Zhejiang Province. GE’s turbines can turn on or off quickly, which support the growth of renewables by switching to natural gas power when wind or solar energy isn’t accessible.
The use of General Electric’s HA gas turbines can help reduce emissions by as much as 60%. With the help of these turbines, the plant can provide an equivalent capacity, which could be produced by burning 1.35 million tons of coal in a year.
The gas turbines will also increase reliability and flexibility by boosting Zhejiang Province’s power-supply capacity and power grid peak shaving capability.
When completed, this 1.7-Gigawatt power plant will help power China’s largest archipelago, which comprises 1,390 islands. The first unit is expected to begin operation by the end of 2025. It is likely to burn approximately 10% by volume of green hydrogen when blended with natural gas in the future.

GE Entry, Volume, Target, StopEntry: with price at or slightly above 117.97
Volume: with volume greater than average
Target: 125.35 area (this is an area, no guarantee it reaches this price, but you should be selling on the way up)
Stop: Depending on your risk tolerance; Based on an entry of 117.97 & target of 125.35, a stop at 114.24 gets you 2/1 Reward to Risk Ratio.
This LONG swing trade idea is not trade advice and is strictly based on my ideas and technical analysis. No due diligence or fundamental analysis was performed while evaluating this trade idea. Do not take this trade based on my idea, do not follow anyone blindly, do your own analysis and due diligence. I am not a professional trader.

General Electric bouncing off 20-EMA.General Electric Company - 30d expiry - We look to Buy at 111.71 (stop at 108.71)
The primary trend remains bullish.
There is no clear indication that the upward move is coming to an end.
Intraday dips continue to attract buyers and there is no clear indication that this sequence for trading is coming to an end.
20 1day EMA is at 111.54.
We look to buy dips.
Previous resistance at 111 now becomes support.
Our profit targets will be 119.21 and 120.21
Resistance: 115.70 / 117.96 / 120.00
Support: 113.45 / 111.00 / 110.00
Please be advised that the information presented on TradingView is provided to Vantage (‘Vantage Global Limited’, ‘we’) by a third-party provider (‘Everest Fortune Group’). Please be reminded that you are solely responsible for the trading decisions on your account. There is a very high degree of risk involved in trading. Any information and/or content is intended entirely for research, educational and informational purposes only and does not constitute investment or consultation advice or investment strategy. The information is not tailored to the investment needs of any specific person and therefore does not involve a consideration of any of the investment objectives, financial situation or needs of any viewer that may receive it. Kindly also note that past performance is not a reliable indicator of future results. Actual results may differ materially from those anticipated in forward-looking or past performance statements. We assume no liability as to the accuracy or completeness of any of the information and/or content provided herein and the Company cannot be held responsible for any omission, mistake nor for any loss or damage including without limitation to any loss of profit which may arise from reliance on any information supplied by Everest Fortune Group.

GE General Electric Company Options Ahead of EarningsAnalyzing the options chain and chart patterns of GE General Electric Company prior to the earnings report this week,
I would consider purchasing the 110usd strike price Calls with
an expiration date of 2023-8-18,
for a premium of approximately $3.85.
If these options prove to be profitable prior to the earnings release, I would sell at least half of them.
Looking forward to read your opinion about it.

Momentum Stock: General Electric CompanyGeneral Electric is a diversified technology and financial services company. It operates in a vast array of sectors including power generation, aviation, healthcare, and financial services. Headquartered in Boston, Massachusetts, it serves customers in Europe, China, Asia, the Americas, the Middle East, and Africa.
Over the past six months, General Electric's stock price has risen a staggering 70.83%, with a one-year increase of 96.90%. The five-year growth stands at 26.88%, and an all-time increase of 1685.87%. This strong upward price movement could potentially interest investors looking for capital appreciation.
In terms of valuation, General Electric has a trailing P/E ratio of 14.65, which compares favorably with the industry average, implying it is undervalued relative to its earnings. The forward P/E ratio, which considers future earnings, stands at 18.14, indicating that the market expects the company to continue growing. The company's Price/Sales ratio is 1.14, which is relatively low and could signify a good buying opportunity.
A key aspect to note in the fundamentals of GE is its EPS. It had an EPS of 7.25 in the most recent financial year. The estimates for the next year are positive with an anticipated EPS of 4.01, indicating that the company is expected to continue to be profitable.
GE's Revenue Per Share TTM stands at 71.68 and they have a positive Quarterly Revenue Growth YOY of 14.3%, suggesting that GE is generating a considerable amount of revenue compared to its competitors. This makes it a potentially attractive option for investors looking for a company with strong growth prospects.
The company's Return on Equity (ROE) stands at 0.2289, suggesting it is efficient at generating profits from shareholders' equity. GE also has a profit margin of 11.31%, indicating it has been successful at converting sales into profits.
The company's dividend yield stands at a modest 0.003, suggesting it may be an attractive investment for income-focused investors, though the yield is relatively low. The forward annual dividend rate is 0.32, and the company has a consistent history of paying dividends, which could be an appealing feature for income-driven investors.
Analysts have a positive view on the company with a rating of 4.2 out of 5, and the target price set by Wall Street is $107.29, slightly above the current price, indicating a positive outlook for the stock.
Insider trading activities reveal a mixture of sell-offs from some of the company's senior executives, which is not unusual for a company of this size and could be due to personal financial planning rather than a lack of confidence in the company's future. It's also worth noting that institutional ownership in the company is high, with the likes of Capital Research Global Investors and Vanguard Group Inc. holding substantial shares. This high level of institutional ownership often indicates a strong level of confidence in the company's prospects.
Overall, General Electric seems to be a fundamentally strong company, with its robust revenue growth, efficient use of equity, and profitability. Its upward price movement, consistent dividend payout, and favorable analyst ratings further strengthen its case. However, as always, investors should conduct their own thorough research before making investment decisions.
In terms of volatility and risk management, a trailing stop loss of around 10% would have kept you in most of this trade. If it broke below that it could have been a good sign to exit and look for a new entry when the trend resumed but the stock seems to be pretty stable and we are still over a month out from the next earnings report.
As always how you interpret and decide to act on any results is up to you. This is just data not financial or trading advice and past performance is in no way any guarantee of future performance. Think of it as a way to spot stocks you might be interested in and can add to your watch list and perform further research on and or discuss with your broker.
Again. Not trading advice . Industries and companies change. Trends can end. Do your own research / discuss it with your advisor, but might be one to watch.

Levels of Interest $GETA levels of interest for NYSE:GE
Please note that this is a preliminary research paper and you should continue to do your own research (DYOR). Information about assets can change rapidly, and it's essential to stay updated with the most recent developments.
Notes on how I personally use my charts/NFA:
Each level L1-L3 and TP1-TP3 (Or S1-S3) has a deployment percentage. The idea is to flag these levels so I can buy 11% at L1 , 28% at L2 and if L3 deploy 61% of assigned dry powder. The same in reverse goes for TP. TP1: 61%, TP2:28% and TP3:11%. If chart pivots between TP's, in-between or in Between Sell levels these percentages are still respected. I like to use the trading range to accumulate by using this tactic.
Just my personal way of using this. This is not intended or made to constitute any financial advice.
This is not intended or made to constitute any financial advice.
FED Macro Situation Consideration:
All TP's are drawn within the context of a return to FED neutral policy. I do not expect these levels to be reached before tightening is over.
NOT INVESTMENT ADVICE
I am not a financial advisor.
The Content in this TradingView Idea is for informational purposes only, you should not construe any such information or other material as legal, tax, investment, financial, or other advice. Nothing contained within this idea constitutes a solicitation, recommendation, endorsement, or offer to buy or sell any securities or other financial instruments in this or in in any other jurisdiction in which such solicitation or offer would be unlawful under the securities laws of such jurisdiction.
All Content on this idea post is information of a general nature and does not address the circumstances of any particular individual or entity. Nothing in the idea/post constitutes professional and/or financial advice, nor does any information on the idea/post constitute a comprehensive or complete statement of the matters discussed or the law relating thereto. You alone assume the sole responsibility of evaluating the merits and risks associated with the use of any information or other Content on the idea/post before making any decisions based on such information.

GE- Oh The Glory DaysGeneral Electric...
There was a time when holding an investment in GE was as American as apple pie
Then came the glory days of Jack Welch and his yearly layoffs
After Jack ran out of people to layoff and morale to crush, Two Jet Jeffrey brought in a new regime
and a new dose of pain...
After billions of market cap erosion and share value destruction GE seems to have found its sea legs..
And its about darn time
LONG GE.....FINALLY

GE Weekly PutBuy Jun-02-23 $101 Strike Puts @ 1.47 Limit to Open
Candle bounced off the top SR channel, for a down turn to the next zone. Tight strike for quick ITM zone. Expires the following week from entry date.

GE with a bullish outlook following its earnings #StocksThe PEAD projected a bullish outlook for GE after a positive over reaction following its earnings release placing the stock in drift B with an expected accuracy of 53.85%.

General Electric AnalysisGeneral Electric, the old behemoth of the American Industry.
Since 2016, half the time GE ended a year with negative profit. At other times profits were less than 8%, all combined, not very good, to say the least.
But, from 2019 to 2022, GE has aggressively reduced its massive debt. Although a drop in equity occurred as well, the debt reduction was more significant with debt/equity dropping from 3.34 to 0.96, year after year. Exceptional. It seems something like this would require major restructuring and a highly disciplined business practice, which is a great feat in and of itself considering the depth of business abyss GE was dealing with.
Even though there is a long way to go to steady income and healthy finances, I am looking forward to the next chapter of this great giant. It will, I'm sure, at least bring us a lot of good business excitement, and possibly, the ever so thrilling story of rags to riches - again.
Have a Great Day.
GE - Double Top Ideadown following a double top
Using curves to show the waves down
Long term bearish

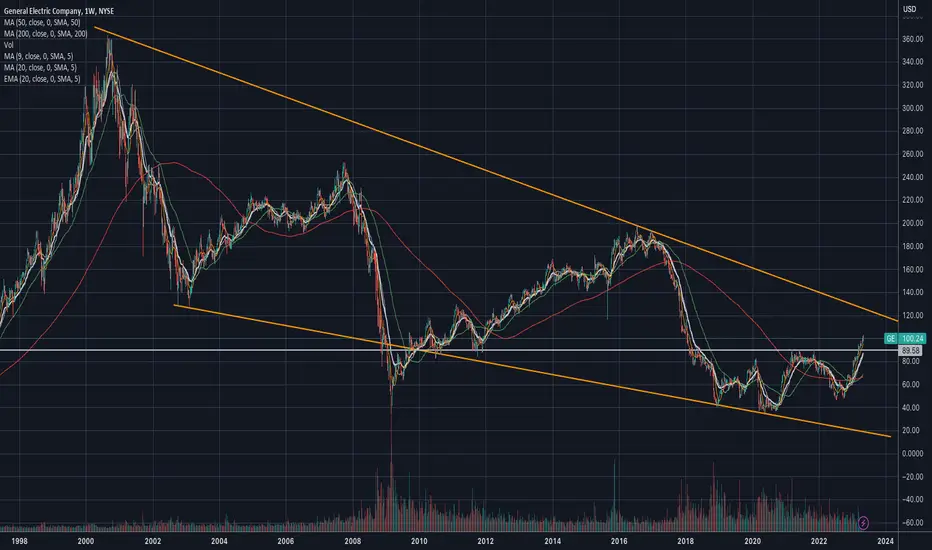
$GE - Epic multi-year descending wedgeNYSE:GE #GE epic multi year descending wedge. Broke above $90 resistance. Could see it heading to that upper trend line around $121 area. Risk of downside is a retest to $90 which will become a support.
$GE Multi-year bear showing signs of slowing or even turning.General Electric's multi-year bear may be showing signs of slowing, while the trend is still down the bulls are starting to sniff around. Getting close to it's 2009 low and at these prices the Dividend Yield of 4% is looking pretty good. Note the diverging indicators in the lower pane suggesting gathering strength in price action. Might be worth a longer term investment at these prices. If earnings are a strong beat I expect the start of a longer term bull.

GE reversing to down trend SHORTGE has been trending recently off a base of consolidation after a downtrend. In the last session,
the reversal began. The 15 minute charts shows price riding the upper bands of the anchored VWAP
in the overvalued and overbought zone. The support resistance indicator of Luxalgo shows that
price bounced down from the resistance zone. The stochastic RSI shows bearish divergence and
loss of strength. I see this an opportunity for a swing short trade which will be synergized if the
general market takes a downturn in the week upcoming. I will play this with put options with
10 DTE at a strike a few percent above market price and look for 50 % return in the 5-7 trading
days upcoming. I will sell a few days before expiration no matter to avoid time decay affecting
the potential profil.

GE Forecast Down May-June20230422 General Electric (GE) Forecast 6/9/23 88.71 (-11% from 99.51 on 4/21/23)

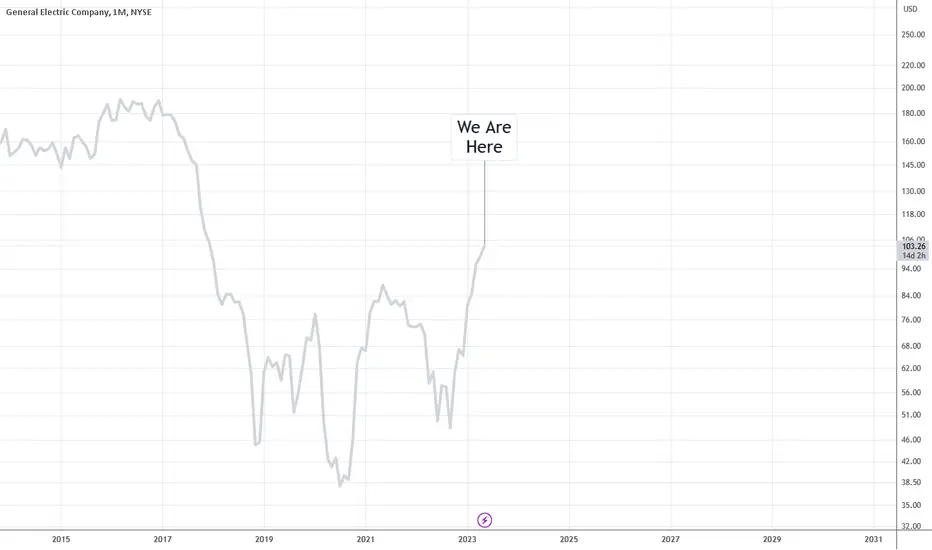
GE Could Beat Inflation (Not Financial Advice)Testing more lines...
These scenarios aren't applicable if GE has any monthly close below 60 USD.
Near term (<2 year) target would be at or before 100 USD. Long term (~3 year) target is at or before 120 USD.
But, this is only a test & not financial advice... More explanation if we do not close below 60 USD this month.

GE Short? Someone tell me what's up with GE! Would love to see some opinions. Looks like a short to me.


Triple bottomPrice is breaking out the MONTHLY resistance, looks very strong. The short term target is the monthly resistance at $115 level.

GEWe can see clear rising wedge pattern also, Bearish divergence in RSI also MaCD, also chart gave me volume signal, which is when price going HH volume more lower.
I am taking risk entry short because its give me less stop loss.

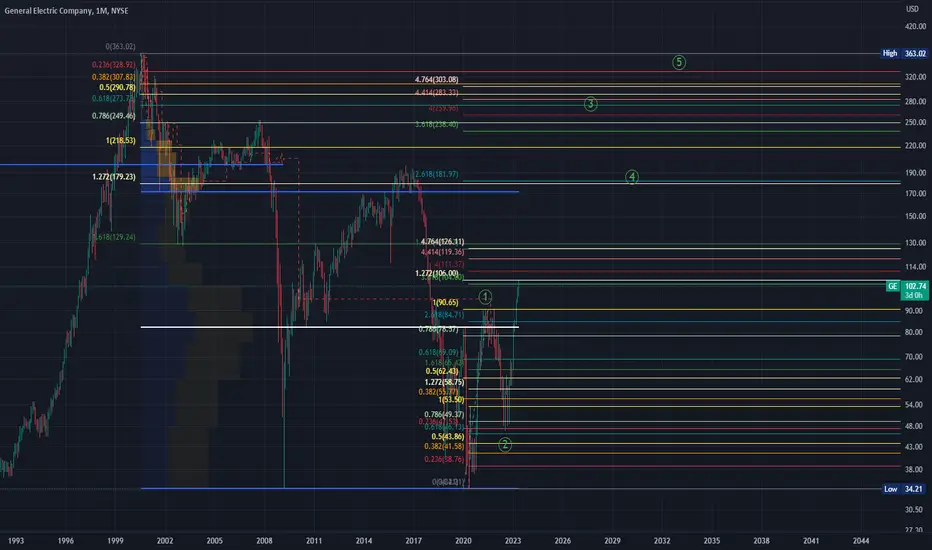
GE TechnicalsGE entered it's 5-year horizontal sell zone today. Here's notable levels on the GE 1 week chart because GE is a slow mover, and it can take a long time for a bearish reversal. Except for an overnight newsworthy current events surprise drop. Plus, I included longer term options data. The two bearish options that stand out to me are the 4/21 expiry Put/Call Volume Ratio 3.77 and 6/16 expiry Put/Call Open Interest Ratio 1.93.
5-year horizontal trend levels:
R3 = $93.55
R2 = $83.66
R1 = $73.77
pivot = $63.88
S1 = $53.99
S2 = $44.10
S3 = $34.21
3/17 expiry options data:
Put Volume Total 554
Call Volume Total 832
Put/Call Volume Ratio 0.67
Put Open Interest Total 56,901
Call Open Interest Total 54,039
Put/Call Open Interest Ratio 1.05
4/21 expiry options data:
Put Volume Total 400
Call Volume Total 106
Put/Call Volume Ratio 3.77
Put Open Interest Total 4,364
Call Open Interest Total 8,356
Put/Call Open Interest Ratio 0.52
6/16 expiry options data:
Put Volume Total 336
Call Volume Total 611
Put/Call Volume Ratio 0.55
Put Open Interest Total 53,802
Call Open Interest Total 27,868
Put/Call Open Interest Ratio 1.93
