1GME trade ideas

That’s a wrapI have been using this fractal for a month. For those who believe fractal is tinfoil, please ignore.
Marked with arrows, are the segments, that have been mirrored as compared to fractal.
A conservative target for tomorrow would be around 48$. If that doesn’t happen tomorrow, then I am early but not wrong.

GME: Buy idea: Golden PointHello traders!!! On GME, we can see that the resistance line passes through the highest points of the candles. Furthermore, the support line passes through the lowest points of the candles. Furthermore, these two lines converge, thus forming a golden point. This configuration of the chart signals an upward trend over a 15-minute time frame.

MOASS: WC: 24.73 Target: 1800-2400 MOASS: 47k-100KTimestamps:
Intro/ FUD & Wave 2 Psychology: 0-6
Last Weeks Expectations: 6-11
Structure & Technicals: 11-29
Next Week, Expectations & Hopium: 29-57
The Cat & RK Tweets: 57-End
MOASS: 06/09 - 07/09

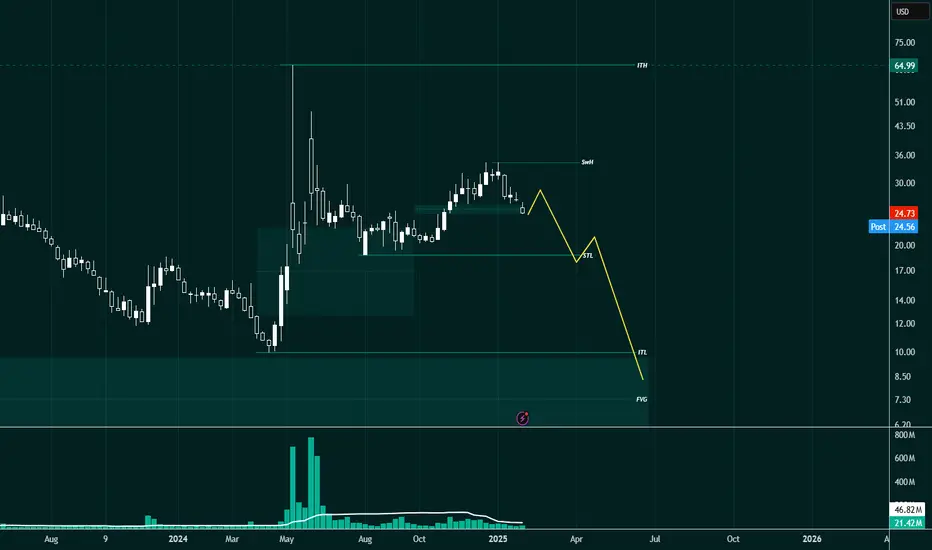
GME - Bearish outlook.GME had its day in the sun, im nothing but certain that that entire escapade was institutional orderflow and capitulation on the back of retail hype. smart move!
Current structure looks bearish on the HTF's, M showing possible failed swing pattern in play, with an unmitigated BISI residing below current ITL formed after the sharp reversal in May '24. (that, may i add, swept buyside liquidity of pretty much the entire past 3 year bear trend!).
On a HTF basis, im anticipating price to run the unmitigated BISI by the close of the year, i could be wrong and we could see liquidity tapped below/inside current internal range liquidity and then price move into consolidation, but, eventually finding its way lower to the M FVG residing below.
Happy trading!
Gamestop Headed For $46GME has recently taken a hit on the bounce of the overall market. This is all a part of the squeeze plan. The chart above is my current trading plan.

GME: Bearish Channel: Buy ideaOn GME, we can see that the resistance line and support line are converging. And according to this configuration of the chart, we can say that we would have a high probability of seeing the market go up.


MOASS: WC: 26.90 Target: 1800-2400 MOASS: 47k-100KTime stamps:
Intro: 0-1
Near term expectations: 1-4
The Cat & RC Tweets: 4-9
Feb 3rd Green Line & Expectations: 9-11
Proper Trading Expectations: 11-27 (most will skip this but I will know if you did by the questions you ask me lol)
What's Next: 27-39
Future Tweets from The Cat & RC: 39-43
Next up from Heartbeat Trading: 43-26
:) 46-End

MOASS: WC: 27.77 Target: 1800-2400 MOASS: 47k-100K (republish)PSA: Having some issues with my posts not showing so had to republish this idea

We are starting from tonightIt’s not moass yet but we start seeing the “boom” from tonight.
Also the frequency of these booms will increase exponentially till it breaks the yellow marker and finally it’s gonna be MOASS!

GameStop GME: 26.18 Break to 34+ SkyrocketMorning Trading family
GameStop's stock is at a crossroads! If it falls below 26.18, it might slide down to 25.50, or even 24.64! But if it jumps over 29, we could see it climb all the way to 34 or more! This could be a big moment for GameStop.
Kris/Mindbloome Exchange
Trade What You See

GME - MOASS Still applicable This is not a financial advice, this just testing my code that I have developed…
Company has more than 4.5B $ in cash and its business have value today and in the future , with no bad news yesterday it went to from 32$ to 27.9$ !!
That’s mean the short squeeze has something hidden and more than what we expect.
The code that I am testing did not gives a sell value until today…. So let us watch what will happen for this stock in the coming days.
Note: The shorts squeeze always need more stocks with less value !!
Good luck.

GME 5yr - Weekly Candle - 40 MA bullish crossover Gamestop 40 week moving average just crossed over the 3 year moving average. Last time we saw this was leading up to the '21 sneeze.
Stock is showing good support between the $25-30 dollar range, if we can hold or exceed this zone, we could see something similar to 4-years ago. Definitely need a catalyst and some volume.
4 year cycle??

I can't believe I'm doing this - Long GME at 27.47I feel icky and dirty doing this because I hate everything about meme stocks. But the truth is, it is the best chart available right now. Everything else that is on sale according to my algo either has a chart that looks like the inside of a dirty diaper, has too little liquidity, or it's in an area I'm already exposed / overexposed to (shipping is on sale across the board). I can't remember a time when so little of any quality has been on sale. It makes me a little worried, actually.
I'd have used NYSE:FRO for this idea, but I feel like it's a conflict of interest since I'm already in it (I have been for a while) and I am SOLIDLY in the red on it. That said, if meme stocks aren't your thing and you think oil is gonna rally any time soon, it's currently paying an 11% dividend for you to wait for it to turn around. Tankers are notorious for frequent, large and unexpected dividend cuts, so buyer beware on that.
Anyway, back to the meme stock that started it all. It's been on a typically ridiculous bull run, going from 20 to 34 in 2 months for absolutely no good reason. Now, it's pulling back and all the NYSE:GME fanboys are wailing and gnashing their teeth and giving up hope, which is usually a bullish indicator in and of itself for a short term rally. They all start buying puts and then get squeezed out when it turns around.
Besides its uptrend, it did respect support from the most recent Dec 3 low and formed a hammer candle, both bullish signs. But in the end it's a meme stock and meme stocks can do just about anything any time. Unless Roaring Kitty dies or gets arrested, a huge nonsensical pop in this one is always possible, too.
Historically, my algo has been just as good on this stock as others (728-4 the 4 being in this past week so far), though it doesn't pay off as well as you'd expect, but I just hate it so much that it's hard for me to trade - especially right after a 75% run up. Up until the recent correction/fanboy panic, it had actually been producing really good, fast paying trade signals this year.
It's been on my algo's buy list for several days now, and I've bought nothing rather than GME, but the price action today gave me a little hope that the worst MAY be over, short term anyway. Plus it has already pulled back 20% so my patience/resistance is getting me in at a better relative price than most of my buys do. But still...EW. Hopefully I can be out of this with a profit tomorrow and never look back.
So as I hang my head in shame, as a matter of professionalism and good conscience, I can't recommend that anyone follow me on this trade. No sense dragging any of you through the muck and mire of the original meme stock. Keep your hands and your conscience clean, my friends...but if you must, be careful. Use protection and take a shower afterward.
Per my usual strategy, I'll add to my position at the close on any day it still rates as a “buy” and I will use FPC (first profitable close) to exit any lot on the day it closes at any profit.
As always - this is intended as "edutainment" and my perspective on what I am or would be doing, not a recommendation for you to buy or sell. Act accordingly and invest at your own risk. DYOR and only make investments that make good financial sense for you in your current situation.

GameStop Bullish Daily SqeezeThe chart says it all. A bullish daily squeeze has formed in GME that is firing long for a buy signal as of today. Expect momentum to carry price to the upside.

GMEWhen analyzing GameStop’s (GME) current price action, it’s clear the stock is navigating a challenging landscape, one that has been defined by a consistent downtrend since late 2024. Currently priced at $27.50, the stock has shown signs of a minor recovery after hitting a low of $26.34, but this rebound appears to be on shaky ground. The question is: can the price reach $26.81 to make a put option profitable? Let’s break this down.
The Technical Landscape
First, the broader trend speaks volumes. GME has been in a well-defined bearish structure of lower highs and lower lows, signaling that sellers still dominate the market. On the chart, resistance lies between $27.50 and $27.70, creating a ceiling for upward momentum, while the immediate support zone is at $26.50–$26.34. These levels are critical because any break below support would almost certainly open the door for the price to reach $26.81.
Another key factor to consider is volatility. GME’s recent price action shows that large, fast moves are still part of the equation. The stock has seen aggressive selling on high volume, but any rallies appear weaker, with diminished volume signaling a lack of conviction from buyers. This dynamic strongly favors continuation to the downside, which aligns with the goals of the put option.
Indicators and Probabilities
Delving into the RSI (Relative Strength Index) on the 30-minute timeframe, if it shows a neutral or overbought reading, it strengthens the case for a retracement downward. Additionally, the volume patterns tell a story: the momentum behind the downtrend appears stronger than any recent attempts at recovery. These technical clues suggest that the probability of reaching $26.81 is relatively high—estimated at around 60–70%, given the current proximity to support and the persistence of selling pressure.
Fundamental Considerations
Beyond the chart, the macro and company-specific fundamentals could play a role. If the broader market or relevant sectors (such as retail or technology) face headwinds, GME may be further pressured. Additionally, news or earnings reports tied to GameStop could trigger unexpected volatility, so staying informed about any potential catalysts is essential.
Strategic Outlook
To capitalize on this opportunity, monitoring intraday price action will be crucial. Watch for a break below $26.50 with significant volume to confirm the downtrend is intact. Complement this with indicators like RSI or short-term moving averages to strengthen the case for further downside. However, discipline is key: if the price breaks above $27.70, it might be wise to reassess or exit, as this could signal a reversal in the bearish momentum.
Final Thoughts
In conclusion, the current setup for GME presents a strong case for further downside, with the price likely to test $26.81. The combination of a bearish trend, weak volume on rallies, and critical support levels nearby gives this trade a favorable risk-reward profile. That said, as always, the market is unpredictable, so staying flexible, disciplined, and well-informed will be the cornerstone of success.
While no analysis can provide absolute certainty in the stock market, I can confidently say that based on the technical setup and current market conditions, the probability of GameStop (GME) reaching $26.81 is high, approximately 60-70%. This is backed by the clear downtrend, proximity to support, and weaker volume on rallies.
However, always remember that markets are inherently unpredictable, and external factors like unexpected news or broader market movements can influence the outcome. As such, risk management remains crucial—set clear exit points and be prepared to adapt if the trade moves against you. This analysis offers a strong foundation, but the ultimate guarantee lies in maintaining discipline and flexibility.

MOASS: WC: 27.51 Target: 1800-2400 MOASS: 47k-100KGeneral Timestamps
Intro/Flag Emoji: 1-6
RK Next Tweet: 6-8
What we saw this week: 8-15
Whats coming next: 15-17, 30-31
Tracking MOASS: 17-43, Green Vertical Lines 38-42
Top Targets, Market Cap, Fundamentals & Talking Heads: 43-49
Have a trade plan: 49-55
Indicators: 49-60
KEY DATES:
01/21
02/03
02/20
03/10
04/21
04/28
05/30
06/09 (MOASS)
06/23
07/09

Just a pattern and timing it The pattern from 2021 is playing out perfectly ,,,,,, we need to start going up to until we touch the upper channel a 3rd time ,,,I’m too lazy to explain, the pattern in white says it all

Ascending Triangle on the Daily for GME!Alright folks, brace yourselves for another electrifying update on the saga of GME! Since our last rendezvous, we've witnessed the impressive cup and handle pattern and the striking inverse head and shoulders breakout. But that was just the beginning. After our latest dip, in tune with the broader market's downturn, we've now sculpted an absolute monster of an Ascending Triangle on the daily chart, also visible even on the 4-hour.
Using the trend-based Fibonacci extension, the golden pocket awaits us at $37.09, with the next pocket above that at $52.58. Adding to the excitement, we've got the Bull Flag breaking out on the weekly chart and the golden cross appearing on both the weekly and daily charts. Not to forget the substantial cup and handle formation on the hourly chart.
Hourly Chart : Cup and Handle: This pattern is setting the stage for potential bullish movement.
4-Hour Chart: Ascending Triangle: Reinforces the pattern seen on the daily chart, confirming the bullish setup.
Daily Chart: Ascending Triangle: Visible on both the daily and 4-hour charts, suggesting an imminent breakout.
Weekly: Golden Cross: This crossover indicates long-term bullish momentum.
Bull Flag: This continuation pattern indicates that the existing uptrend is likely to continue.
All signs point to an explosive few months ahead for GME, with multiple breakouts on the horizon. Stay tuned, because the next chapter of this epic journey is about to unfold

The Hardest Part About Trading Isn't The Charts-Its Your MindWhen I first started trading, I thought the key to success was all about the strategy. If I could just figure out the right indicators or master technical analysis, I’d be unstoppable.
But the truth hit me hard. I wasn’t losing because I didn’t understand the charts—I was losing because I didn’t understand myself.
Here’s how I learned that the biggest battle in trading isn’t with the market—it’s with your own mind.
Lesson 1: Stop Obsessing Over Results
I used to get way too caught up in the outcome of every single trade. A win would make me feel on top of the world, but a loss? That would send me into a spiral. I’d overanalyze, doubt myself, and sometimes even swear I was done trading altogether.
One day, I realized I was focusing on the wrong thing. Instead of asking, “Did I win or lose?” I started asking, “Did I follow my plan?”
That simple shift changed everything for me. I started measuring success by how consistent I was, not by whether every trade was a winner. The funny thing? Once I started doing that, the wins came more naturally.
Lesson 2: Losses Aren’t Failures
I’ll never forget the trade that wiped out 30% of my account. It was gut-wrenching. I felt like I’d failed—not just as a trader, but as a person.
It took me a long time to understand that losses are part of trading. Even the best traders take hits. What separates the pros from the rest is how they handle those losses.
Now, instead of beating myself up, I treat losses as a chance to learn. Did I miss something in my analysis? Did I break my rules? Sometimes, the market just didn’t cooperate, and that’s okay.
Lesson 3: Don’t Let Emotions Run the Show
I can’t tell you how many times I’ve let emotions wreck me. Chasing losses, revenge trading, doubling down on bad positions—I’ve done it all. And every single time, it made things worse.
The biggest game-changer for me was journaling my trades. Not just the technical stuff, but how I felt during the trade.
-Was I calm or anxious?
-Was I trading because it was a good setup or because I felt like I had to?
It was eye-opening to see how much my emotions were driving my decisions. Now, if I feel frustrated or off, I don’t even touch the charts. I’d rather miss a trade than make a bad one.
My Biggest Takeaway I Learned
Trading isn’t just about the market—it’s about you. The strategies, the charts, the setups—they’re important, but they’re not enough. You need to master your mind if you want to master the market.
I’m not perfect, and I still have tough days. But every step I’ve taken to manage my emotions, stay consistent, and focus on the process has brought me closer to where I want to be.
If you’re struggling with the mental side of trading, I get it. I’ve been there. Send me a DM or check my profile—I’m happy to share what worked for me and help however I can. You don’t have to do this alone.
Kris/Mindbloome Trading
Trade What You See

GME liquidity 15Jan , new average time layered liquidity Short video with an historical look back explaining the new interation of our 'time layered liquidity sentiment indicator" Average Line. Hope this helps you escape any confirmation bias that might be caused by my analysis :)

$GME Up Up UpAnalyst Projections:
CoinPriceForecast: Predicts GME reaching $45 by the end of 2025, suggesting a potential increase from its current price.
Longforecast.com: Estimates GME's price in June 2025 to range between $27.67 and $32.49, indicating modest growth.
ExlaResources.com: Projects GME starting at approximately $25 in January 2025 and potentially reaching between $36 and $60 by year's end.
Considerations:
Market Sentiment: GME's stock has experienced volatility, often influenced by social media and retail investor activity. For instance, a recent tweet by Keith Gill, known as "Roaring Kitty," led to a notable surge in GME's stock price.
Business Fundamentals: Analysts express concerns about GameStop's core business profitability. Wedbush analyst Michael Pachter notes the company lacks a viable strategy to leverage its cash reserves for new ventures, especially after unsuccessful attempts like the NFT business.
Conclusion:
While some forecasts suggest potential growth for GME by 2025, the company's future performance is uncertain due to market volatility and challenges in its core business operations. Investors should conduct thorough research and consider their risk tolerance before making investment decisions regarding GameStop.
