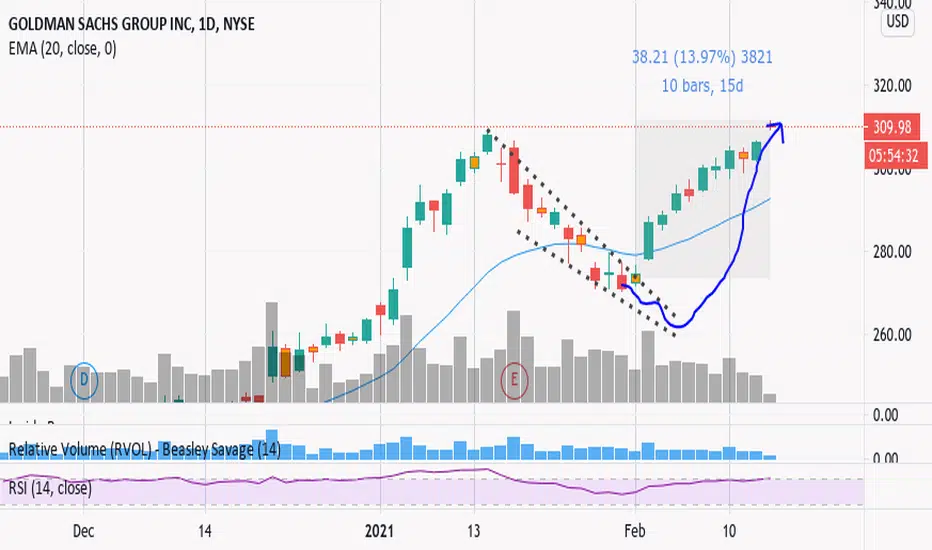
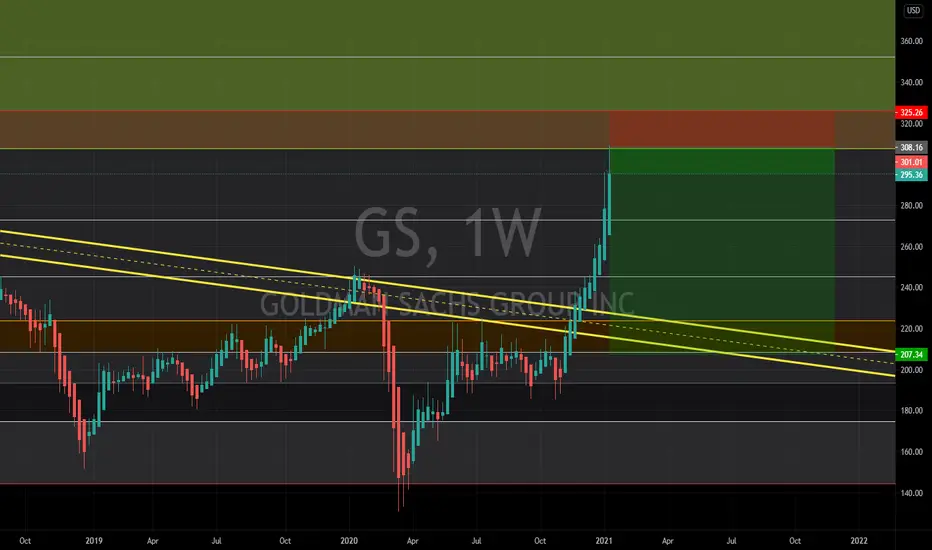
+14% Move in $GS falling wedge , i posted it here for you .We made a new 52WH and it looks higher too .
It takes a lot to make money , not only charts and technical , you need to trust your own views .
1GS trade ideas
GS tryna dig a hole to China (for now)Boy do I love gartleys.
Goldman Sachs hit the double top. I predict the value will fall for a few months. But remember gartley is a harmonic pattern rooted in human emotion and this is a fairly large scale to be applying that sort of TA to.
For now I think it's a safe bet to assume the value will fall over the next few months. Target between $242 and $214 if the trend continues.
What do you think?

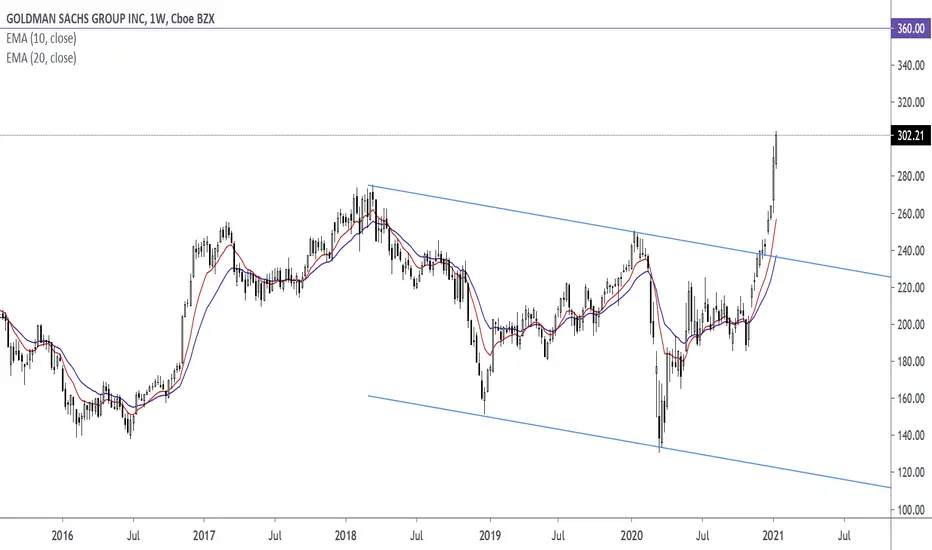
Bull Flag Cup&Handle Broke UP from Rising Wedge ABC BullishGS has never broken the bottom trendline of the bearish rising wedge it traveled in and has made a lot of gains since breaking up and out of it..You can see rising wedges by the trendlines sloping up and toward each other with a lack of touches to the bottom trendline. I have noticed several stocks do this, break up from a RW, but there is usually a deep pull back later on, ie CRM broke up and out when added to the DOW. Bearish confirmation of the pattern does not come until the support line is broken in a convincing fashion. While it is a consolidation formation, the loss of upside momentum on each successive high gives the pattern its bearish bias. However, the series of higher highs and higher lows keeps the trend inherently bullish. The final break of support indicates that the forces of supply have finally won out and lower prices are likely. Because the two levels are not parallel it’s considered a terminal pattern. This implies that it must eventually come to an end. But who knows when?? LOL May go up forever for all I know (o: GS did break bottom trendline of the larger rising wedge and formed a flag and an abc bullish pattern in the process.
Maybe it will never come back down to the lower, smaller RW? AAPL has not done so yet..
There is also a prior cup and handle pattern, an ABC bullish formation and now a Bull Flag! I bet the best matador could not kill this bull! But Mr Market will but it may not be anytime soon and there is not way to know when.
Short interest is on the low side despite the presence of rising wedges. NV and OBV are very high...
I would just be careful..but I am not in this one so do not listen to me )o:
Not a recommendation and be safe..
$GS 1h XLF is Bullish according to the heatmapScanned the the heat map chart and financials along with XLI is bullish. Calls above 290.74 looks good for an entry to me.

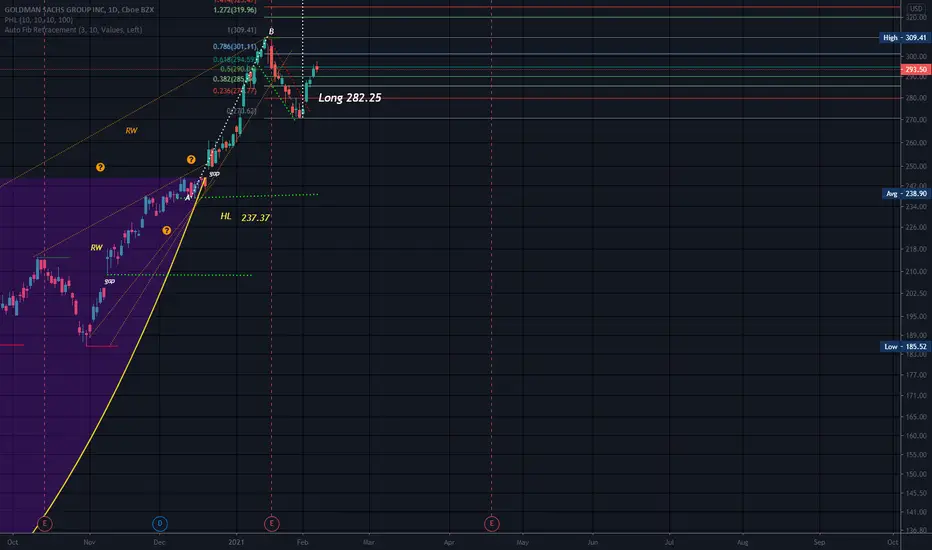
GOLDMAN SACHS Trend Analysis + LEVELS GSGS is going through the correction. This should be a good opportunity to open LONG TERM positions for HOLDERS.
ENTRY LEVELS LONG:
$264
$252
$222 - STRONG BUY


Oldman Sachs 👴🏾Reddit, WallStreetBets, GameStop, Silver, Dogecoin, Shortselling, Twitter and so on. These key words are currently dominating the financial world. But what comes quickly, fades quickly, too. Let us not be distracted that there are thousands of well-managed and strongly positioned companies that await your investments. While many assets’ future already are gambles in themselves, there are some assets that have withstood time and will almost surely back you in retirement or pay off your children’s and grandchildren’s tuition fees. One of those assets is the Goldman Sachs stock. Currently declining, there might be a great opportunity opening up for an entry within the yellow box. Between $260.49 and $269.12, we expect a turnaround and a soaring Goldman. On its way up, it will surpass the marks of $281.90 and even $317,76, aiming for new peaks. It is important to note, however, that the price should not drop below $260.49, in order to keep the current scenario alive.
Follow us for daily updates!


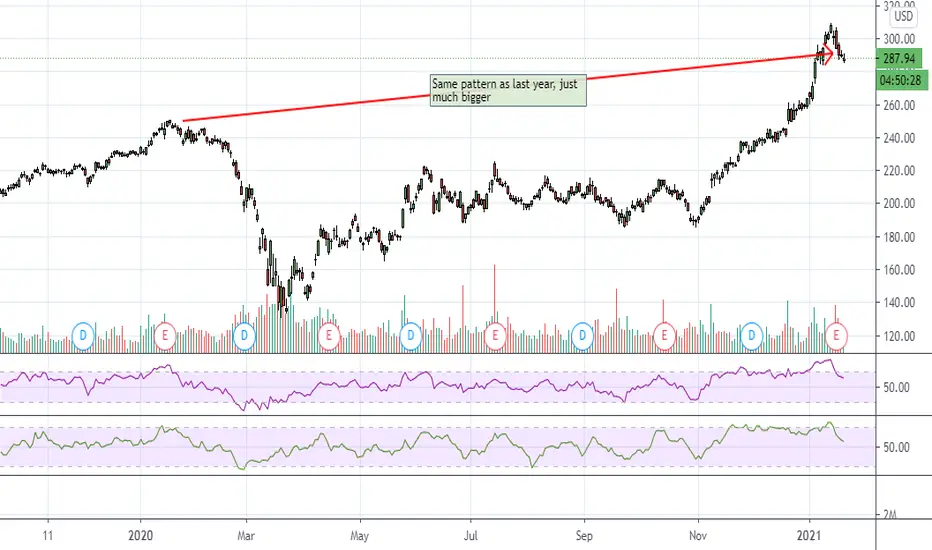
GS/XLF/financials chart patternChart pattern for financials are the same as last year, expecting a bounce Monday then whipsaw.
This was probably the top for financials anyways, I'm pretty sure everyone's refinanced by now and rates can;t go any lower.
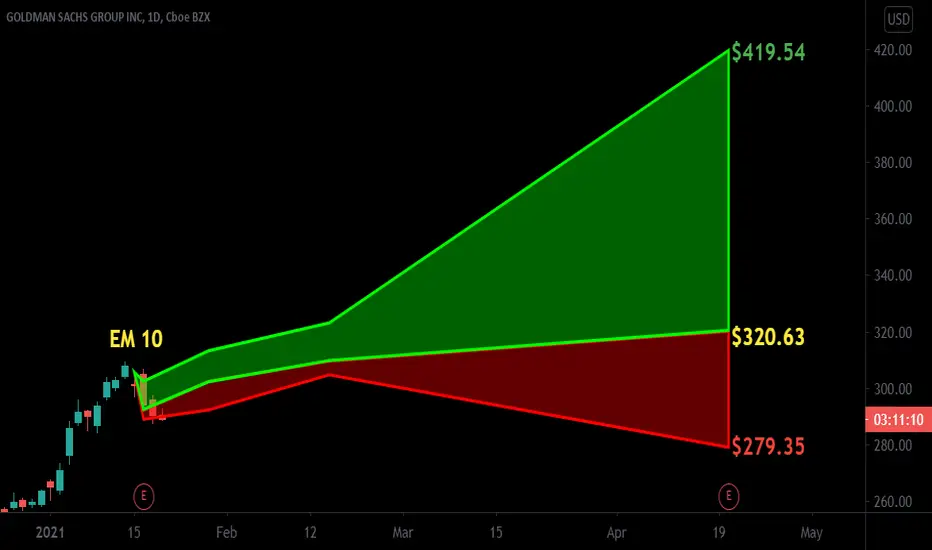
$GS with a slight bullish outlook following its earning releaseThe PEAD projected a slight bullish outlook for $GS following a negative under reaction after earnings release placing the stock in Drift D
If you would like to see the Drift for another stock please message us. Also click on the Like Button if this was useful and follow us or join us.

Goldman bearish swing to $218.70One of the limits for the year has been triggered by this stock so I am short the stock.
I typically close instruments based on weekly close so a weekly close above $307 is my reason to close and potentially switch sides.
This trade will be held for weeks once it goes into profit.
I got filled at $298.36 with a SL of $310 with a target of $218.7
This is for entertainment purposes only.
Trading come with risk and you should consult a financial advisor for financial advice.

Cup and Handle Rising Wedge Under Price )o:GS broke up and out of a Rising Wedge. The RW is below price..
Rising Wedges are most often bearish so be safe. They are long term patterns and not valid unless bottom trendline is broken. Very few stocks that I have followed broke up and out of a rising wedge. CRM did at 208.28 (upper trendline of CRM's rising wedge) a while back when introduced to the Dow. Crm went on to rally upward for quite a while. If a security breaks up from a RW, it is usually not a long term break and will most often come back down to the wedge or through the bottom trendline.
This one may just keep going up forever (o: Only time will tell/The top of the bottom trendline of rising wedge is 238.75/top trendline is 251ish/From what I see, there are 2 RWs in that vicinity..
Mid cup is 190.65 Cup Low is 118.85 Cup low is 119.60
Good idea to do your research/Not a recommendation/Just an observation


Sell Goldman Sachs 300$ to target price 285$Open short position at GS from 300$ to target price 285$ it's 5% gain, with stop 310$.
Reasons - momentum valuation, banks overvalued
Look previous GS deal below short 260$ to 250$.

Goldman Sachs | Uptrend The financial sector leading this rotating while the tech companies struggle. Goldman Sachs and this impressive uptrend and new all time highs! NYSE:GS


GS long idea, over 273 for ATH. Buy time and go long if youre trading options. Otherwise bank buybacks are going to be a huge pump for the start of 2021!

$GS - Ascending Triangle into JanuaryAscending Triangle on the 2hr into the end of the year following a strong run in Q4.
Bullish news by Fed regarding bank buybacks that has yet to be taken advantage of by $GS.
Entry: >$263
TG1: $269
TG2: $276
Extended TG3: $283
Invalidated: <$254
Like & follow if you enjoy my work :)

GS ascending triangle breakoutAnother great R/R setup here with NYSE:GS . Although there are two candles that broke above the resistance line, they quickly corrected back to the trendline. Today's doji candle is a good sign of the strength of the trendline. The stop will be on the break of this trendline and the first major target is 262 followed by 267. Due to the shortened day as well as New Years low volume, it is possible for this setup to be invalidated rather quickly, so play accordingly.

