Honeywell: Quantum Leap or Geopolitical Gambit?Honeywell is strategically positioning itself for significant future growth by aligning its portfolio with critical megatrends, notably aviation's future and quantum computing's burgeoning field. The company demonstrates remarkable resilience and foresight, actively pursuing partnerships and investments designed to capture emerging market opportunities and solidify its leadership in diversified industrial technologies. This forward-looking approach is evident across its core business segments, driving innovation and market expansion.
Key initiatives underscore Honeywell's trajectory. In aerospace, the selection of the JetWave™ X system for the U.S. Army's ARES aircraft highlights its role in enhancing defense capabilities through advanced, resilient satellite communication. Furthermore, the expanded partnership with Vertical Aerospace for the VX4 eVTOL aircraft's critical systems positions Honeywell at the forefront of urban air mobility. In the realm of quantum computing, Honeywell's majority-owned Quantinuum subsidiary recently secured a potentially $1 billion joint venture with Qatar's Al Rabban Capital, aiming to develop tailored applications for the Gulf region. This significant investment provides Quantinuum with a first-mover advantage in a rapidly expanding global market.
Geopolitical events significantly influence Honeywell's operational landscape. Increased global defense spending presents opportunities for its aerospace segment, while trade policies and regional dynamics necessitate strategic adaptation. Honeywell addresses these challenges through proactive measures like managing tariff impacts via pricing and supply chain adjustments, and by realigning its structure, such as the planned three-way breakup, to enhance focus and agility. The company's strategic planning emphasizes leading indicators and high-confidence deliverables, bolstering its ability to navigate global complexities and capitalize on opportunities arising from shifting geopolitical currents.
Analysts project strong financial performance for Honeywell, forecasting substantial increases in revenue and earnings per share over the coming years, which supports expected dividend growth. While the stock trades at a slight premium to historical averages, analyst ratings and institutional investor confidence reflect positive sentiment regarding the company's strategic direction and growth prospects. Honeywell's commitment to innovation, strategic partnerships, and adaptable operations positions it robustly to achieve sustained financial outperformance and maintain market leadership amidst a dynamic global environment.
1HON trade ideas

Honeywells Amazing ComboToo late to take advantage of this amazing harmonic activity but both reacted supremely!
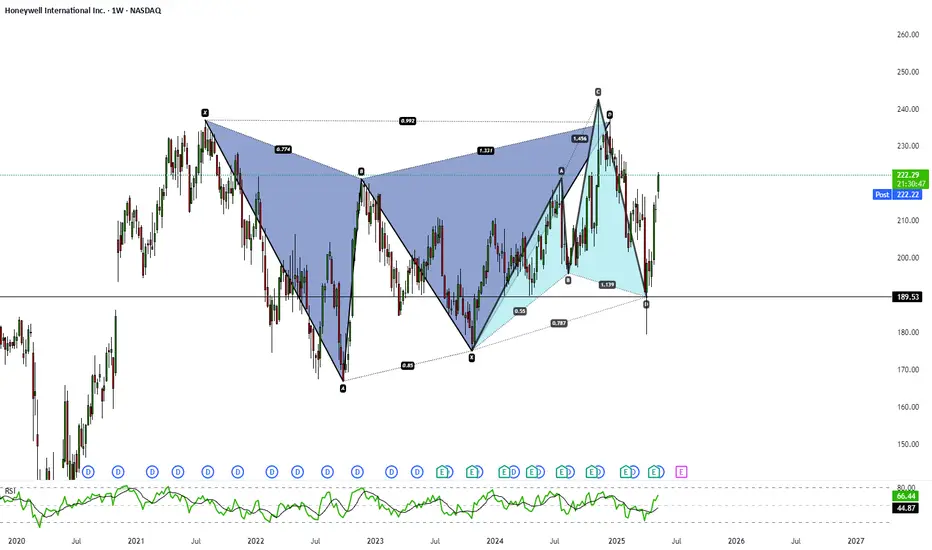
Honeywell Boosting Off. HONABCDE down (skewed HnS pattern) downward and then reversal with bounce off with two bullish candles with vWAP cross. Kennedy channeling used for some Fib goals in this possible upgoing zigzag. Good luck to all.

short-term target of 240 for #HONI have a short-term target of 240 for HON. I don’t rely on it heavily, but analysts' targets support it. I’ll review the numbers next quarter to see if it fits the portfolio and meets expected profits. First, I need to get my entry point.

A Birds Eye View Of HONEYWELL Reacting Extremely Harmonically! It was such a wonderful thing to step back a take a close look at Honeywell. More harmonic than most assets!

HONEY won't fall down the WELL! Bottom is nearNASDAQ:HON - HoneyWell
- Uptrend since COVID (2020)
- At the bottom of the channel
- Massive Volume Shelf
- Key Support/ Resistance Area (S/R)
- Wr% at Green Support Beam
To me the downside looks limited here. When this ship turns it probably goes to $300🎯
Not financial advice

Bullish Alert: Honeywell (HON) Targets $253.76 – 12% Upside Honeywell International Inc. (HON) shows strong bullish momentum, with higher highs and higher lows confirming a continued uptrend. The price is on track to reach the critical resistance level at $253.76, representing a potential 12% upside from current levels. Each pullback has been met with strong buyer support, keeping the bullish structure intact. With sustained momentum and clear breakout potential, this is a powerful signal for further gains.📈🔥

Honeywell International Inc. | Chart & Forecast SummaryKey Indicators On Trade Set Up In General
1. Push Set Up
2. Range Set up
3. Break & Retest Set Up
Notes On Session
# Honeywell International Inc.
- Triangle Secundary Bias | Support&Resistance
- Entry Bias Hypothesis | Double Formation
* 012345(0&1) | Triangle Infliction
- Retracement Center | Uptrend
- 012345(0&1) | Wedge Structure
* Triple Formation | Demand=Previous Trend
Active Sessions On Relevant Range & Elemented Probabilities;
London(Upwards) - NYC(Downwards)
Conclusion | Trade Plan Execution & Risk Management On Demand;
Overall Consensus | Buy

Honey well may trend into new high in times to comeNASDAQ:HON is a long-term play as positive price action is looking at a renewed uptrend. First, the stock has broken strongly above the bearish gap resistance zone accompanied by high volume. 2nd long term MACD histogram has started to turned positive and oversold signal by the mid-term stochastic is back after confirming the oversold signal.
Weekly chart shows clearly long-term bullish signal such as the resistance zone has been tested multiple times and has been weakened. Furthermore, 14-weekly period RSI is rising, confirming the bullish momentum and ADX is bottom out and rising. DM+ is above the 25-level.

HON has give a major breakout Yesterday.HON gave a major breakout Yesterday. a bullish movement up to 247 can be expected.

HONHON is a very strong stock with powerful indicators. Strong patterns have already been activated, and prices are expected to explode very soon. Entry from $212.70 to $210. Stop loss at $185. Our target is $260 to $264.5.

The 3 Reasons Why You Should Buy This StockOn mainstream media
you may have heard that this stock hit a downgrade
and hence was not a good buy to consider all.
First , you should not short
this NASDAQ:HON stock price
Second , try not to use too much margin
when trading this stock price.
Third , create a system that will help you understand
trend analysis..
This is why in this chart we are using
something called the rocket booster strategy
This strategy has 3 Steps:
Step#1: The price has to be above the 50 EMA
Step#2: The price has to be above the 200 EMA
Step#3: The price has to gap up in a trend.
If you try your best to understand
the re-entry of trading systems then you
will be in a better place to understand trading
the capital markets.
Remember to rocket boost
this content to learn more.
Disclaimer: Trading is risky please learn risk
management and profit-taking strategies.

Baby buy HON for the holidays Ticker: HON
Key data:
* Market cap: $144.24b
* Dividend yield: 2.04%
* PE: 25.04
Execution metrics:
* Entry:$222.02
* TP: $226.09
* SL: $202.28
Profit paths:
* Buy shares at market open
* Nov01 222.5/215 Bull Put
Technical Support:
* Money flow: Positive
* POI: 2 ATR
* Justification: Consolidation at demand. Closing higher. MA supporting bulls.
Fundamental Support:
* Analyst 1Y target: $228.70
* Next earnings: Oct 24 2024
* Justification: net income increasing QoQ, revenue, short + long term assets > liabilities

Boring old HON is not as boring as you thinkHON happens to be oversold. But I didn't choose it for that reason. I chose it mostly to teach a couple of lessons about trading. I won't probably be updating this idea daily though, because I'm not trading it and I have too many other things to keep track of already. I will try to check in on it once a week or so.
So why did I choose HON? If you asked 100 traders to pick a stock to trade, I'd bet tons of money ZERO would pick HON. It's as sexy as a nun in a parka. For years all it did was go up every day and paid dividends. Yawn.
For the last 45 months it has done nothing from a buy and hold perspective. Literally. It has gone down exactly 23 CENTS. Its 5 year Beta is 1.03. Boringggggg.
In this case boring is perfect, though. This is a great stock to trade. Sideways choppiness is a dream for what I do. Drawdowns tend to be small and not last very long, so I don't need to deploy lots of capital, and the zig-zags = 🤑. The buy and holders make nothing on a stock like this over this time frame and the trend-followers lose a TON in this situation with all the whipsaws stopping them out with a loss.
But this boring company that makes thermostats, fire suppression equipment and PPE would have afforded me 119 trade opportunities in 45 months and outperformed the AAPL backtest I just posted the other day. More on the backtest results for HON later.
The other reason I love unsexy stocks (and so should you if you trade) is that they can be profitable and offer relative safety when tech, or the market in general, is floundering. The more tools in your toolbox (in this case stocks in your trading universe), the easier it is to make money trading. There is a place for boring stocks that just go sideways in my toolbox, and when you see the results you'll find out why it's a very special place.
I honestly didn't expect the results to be all that good. It was going to be a lesson about how lots of small very boring wins add up. And they were mostly small and boring. Almost 1 in 3 trades during this 45 month span made less than 1% and ZERO trades even made it to 10%.
That doesn't scream profits. But there is huge value in what I do, in the consistency it offered. With relatively short and infrequent capital-hungry drawdowns, coupled with lots of trading opportunities, the annualized profit ended up beating out AAPL. Imagine if I said HON > AAPL to most traders on this site. I'd get crucified. It's just not sexy enough for what most people here do, which is try to hit home runs. But just ask Ichiro what lots of singles can do. Sorry for the baseball reference for all you non-fans.
Trades: 119
Closed wins: 117
Open "wins": 1
Open "losers": 0 (hypothetical trade opened at the end of the day today)
That's technically a 100% win rate over 45 months. I will fight anyone who wouldn't take that.
Average gain per trade = +2.3%
Median gain per trade = +2.2%
Average holding period = 20.4 days
Median hold period = 13 days
Most common hold period = 5 days
Those average gain numbers are NOT special. Most would turn their noses up at a trade that takes a month and only makes 2.3%. Not me. Here's why.
Max number of lots held = 13
That allows capital to be freed up to work elsewhere.
Return per lot per day held = +.112%
Annualized return per lot per day held = 28.2%
I will take that return for ever and ever and ever. And you should too when you trade. 28% per year doubles your money in 2.5 years and over 10 years increases your original money 16x if it happens consistently. I'll always take better returns, but there's a lot to be said for CONSISTENT returns that keep you in the game, keep you motivated and to grow your trading capital. Hunting big wins comes with the inherent risk of big losses. A few of those losses strung together and you're looking for a second (or third) job.
Learn to love small but very consistent wins and you will be in this game for a long time.
So let's pretend I opened 1 lot at 201.64 at today's close and see where that takes us. I'm guessing up.

$HON Resistance DropNASDAQ:HON was overvalued and hit a point of resistance around $207. It is currently heading downwards at an average buying price. This doesn't necessarily mean it's a good time to buy, as the momentum is still downwards. Could we see a drop to $178?

Honeywell eyes Pentagon space contracts with CAES acquisitionHoneywell International Inc. has announced its acquisition of the defence electronics business of CAES for 1.9 billion USD, a strategic move aimed at securing a foothold in the rapidly growing sector of military space equipment. This acquisition excludes the division of CAES that handles satellite ground terminals but includes critical electromagnetic protection technology for radio frequency equipment.
This technology positions Honeywell to offer advanced communication systems for space, sea, air, and land applications, which are resistant to interference. With Honeywell's revenues nearing 37 billion USD last year, the acquisition is not just about expanding business size but strategically acquiring technology that will enable Honeywell to compete for lucrative military contracts in the coming years.
Exploring investment opportunities, let’s analyse the stock chart of Honeywell International Inc. (NASDAQ: HON) from a technical analysis perspective:
On the Daily (D1) timeframe, Honeywell's stock has recently broken the resistance level at 211.05 USD, establishing new support at 206.00 USD. While a new resistance level has yet to be confirmed, the stock is exhibiting a strong uptrend. Should a downtrend begin, a potential downside target could be at 197.50 USD.
If the uptrend persists and the stock price rebounds off the current resistance level, there could be a buying opportunity with a short-term target of 225.00 USD. For a medium-term investment strategy, should the positive momentum continue, the stock price might rise to 235.00 USD.
—
Ideas and other content presented on this page should not be considered as guidance for trading or an investment advice. RoboMarkets bears no responsibility for trading results based on trading opinions described in these analytical reviews.
The material presented and the information contained herein is for information purposes only and in no way should be considered as the provision of investment advice for the purposes of Investment Firms Law L. 87(I)/2017 of the Republic of Cyprus or any other form of personal advice or recommendation, which relates to certain types of transactions with certain types of financial instruments.
Risk Warning: CFDs are complex instruments and come with a high risk of losing money rapidly due to leverage. 69.88% of retail investor accounts lose money when trading CFDs with this provider. You should consider whether you understand how CFDs work and whether you can afford to take the high risk of losing your money.

New bullish setup for $HONThis bullish triangle is going to be broken soon.
The weekly chart sees a possible break of the pattern supported by bullish EMAs and bullish price action

Honeywell: Nearly There!Honeywell almost made it to the resistance at $210.61, which it should overcome as part of the current magenta wave (3). However, there is still a 32% chance that the price will pull back down into our magenta Target Zone between $188.24 and $180.93. This short-term bearish alternative scenario will be triggered if HON drops below the support at $189.66 before reaching a new high.

DESCENDING TRIANGLE WEEKLY BREAKOUT...SHORT TERM BUY BUY BUYWeekly Breakout of HONEYWELL and there is a resistance at 209-210. If it break that level which creates double bottom pattern breakout as well. Buy at or above 210 for a target of 234-235.

HONEYWELLHoneywell international, inc. American multinational holding company. It provides different commercial and consumer products, engineering services, and aerospace systems to a wide range of customers, from private customers to large joint-stock companies and governments. I liked the long-term chart very much and wanted to share my opinion.

HON WEEKLY CHART Im in the process of reading EDWARDS AND MAGEE book. I'm on chapter 8, reading about triangles, and going through charts. It appears to me the HON has formed a symmetrical triangle, and I couldn't help myself. I had to make this chart. Now idk if I'm right or wrong about my analysis or what I'm seeing on the chart. BUT it's pretty cool to see this chart right after reading about it. I like it above 212 back to the old highs.

HON: bullish price actionThe 200-day and 200-week are acting as major pivotal support.
A price action above 197.00 supports a bullish trend direction.
Increase long exposure for a break above 201.00.
The target price is set at 206.00.
The stop-loss price is set at 192.00.
The MACD (lower panel) confirmed a bullish crossover and might support the stock in some upside price potential.

Long-term position in Honeywell International, Inc. $HONLast Monday, I have entered into a long-term position in Honeywell International, Inc. NASDAQ:HON ;
Timeframe: M
SL: ~$179
Target: $250
