$HOOD basing$HOOD consolidating in the 0.786 and 0.886 fib levels. Need a candle closing over the 9 VWEMA, holding above it and a nice green volume day as well to trigger me buying. Megabulls can start their position in this area but I prefer to wait
1HOOD trade ideas

$HOOD cheap upside playCould the broker of the apes get some more action again soon.. hard to see this one settling down forever.. with 30 day HV at 141% and OCT vols at low 60s seems reasonable to buy premium if you believe a bounce is coming.. right sided skew also provides opportunities for call spreads too..

$HOOD Short ideaIt is heading down. Trends is currently bearish.
But $38 is the IPO price which is crucial support for now.
If it breaks down $38 price level it might hit around $30.
If it breaks the resistance line of the down trend it might hit around $50 in near term.

$AAPL $HOOD $PSFE $SPOT I OptionsSwing WatchlistHOOD 2H I Has an average price target of $55. Its still trading within a possible falling wedge. Watching for a bullish divergence on the RSI when it tests $40.
PSFE 1D I PaySafe has an average price target of $14, or a 65% upside from here. It is nearing all time lows, and a bullish divergence on the RSI might be forming.
AAPL 1D I The 'slight pullback' we mentioned last week happened as AAPL tested the top of our trend line. We have support at $144, $140. Big tech seems exhausted.
SPOT 1D I In light of the recent news coming out from the Epic Games vs. Apple case, I will track SPOT. I have set alerts at $255 for calls and $245 for puts.

$HOOD watchingRobinhood made its first daily 9. Weekly chart might print the first bull candle week since the pullback. If daily doesn't form a good base next week we might be looking at either 13 combo or sequential.
An explosion on the daily volume bar over 20 day average could signify a bottoming entry.


HOOD Bounce of banana support$HOOD - Potentially rounding out a bottom here making higher lows.
Target: $45
Trigger: Price >$43.85
Invalidated: Price < $40
Trade Vehicles:
Degen: 9/10 $45C @ $0.73
Conservative: 10/1 $50C @ $1.13

RobinHood Best Broker Online Lets do it guys, under band is like a support we also have the fib zone like a support + this company has huge profits and its extreme popular among all other brokers has a good system good earnings we believe in this. LETS GOO HOOD GANG.

HOOD to $40After the recent SEC news that they may come after HOODs most crucial methods of gaining revenue, profit from order flow, I am buying puts towards $40. As we can see from TA, a bearish flag is forming. Looking for take profit levels shown by the percentage projection markups.

HOOD - Robinhood / Short Memories / The Confederacy of the DunceHoodiots are a common breed. Freshly minted, young, inexperienced investors looking to get their Game Stops on in the markets.
600,000 new accounts (Probably FAKE bot accounts sponsored by Citadel, lol) opened in a single day.
Hoodiots seem to easily forget their accounts were locked out of Buys, only Sells.
Were a broker to ever do this, they'd be 86'd to the curb forever, but Hoodiots "Believe" it's ok.
It is not.
$3.4 Billion was required to meet settlements... stability?
No.
DTC can cut Hoodiots heads off in an instant, they've done so... but hey, they'll never do that again!
Wrong.
More vague excuses, misinformation - "It is for your own good", "We are increasing Liquidity"
Accept that they ran out of cash. Keep moralizing their decision and citing misinformation.
RH eroded trust and went to none other than JPM for a $Billion... the very edifice you all claim
to beat back every day... stopped both buying and selling, except to close existing positions.
Laughable.
Unless you’re paying for trades you’re routed to someone buying order flow.
E*TRADE, Ameritrade, etc sell order flow for revenue.
You're a long con sucker.
Preventing buying and selling - except to close existing positions. You are your
own Margin Liquidity Trap - a death spiral.
You moved your Capital to a Fault Line, expect earthquakes.

$HOOD 50% drop from IPO highI have been observing hot IPOs price action for a while. If it is a hot stock, there are 2 ways it usually goes:
1. Straight up drop 50% from the IPO day, then finds good entries there. Example: $COIN
2. Get super hyped and went to the roof. Made IPO high, then drop 50% and find good entries there. Example: $CRWD, $SNOW, $ZI
I believe $HOOD belongs to the second category. Current price is a low risk entry for those who are interested in owning it. Beware of the drama with the SEC about Payment for Order Flow and gamification of stock trading.

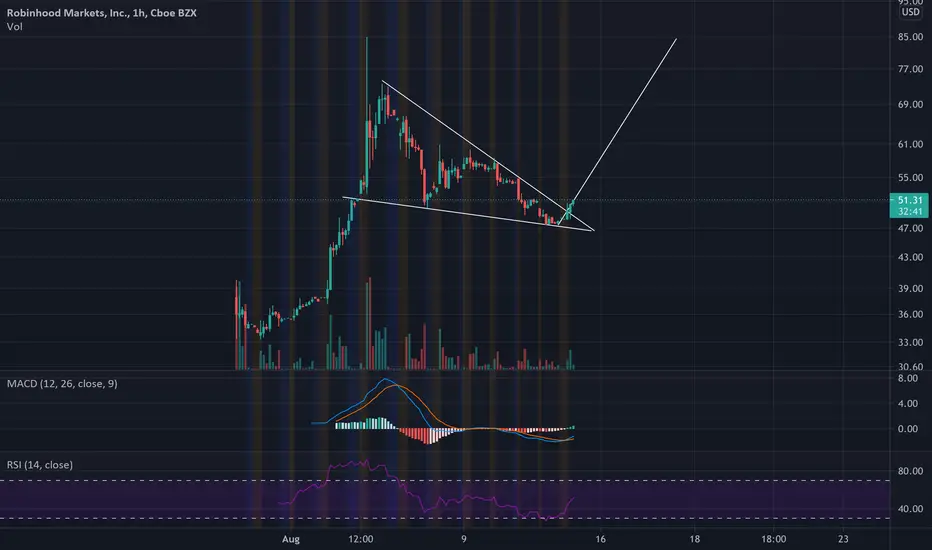
$HOOD Hourly Inverse head and shoulders$HOOD looking pretty bullish on the hourly chart with the clear inverse h&s currently forming the right shoulder.

Robinhood (HOOD)Recently listed Robinhood (HOOD) breaks out of falling wedge pattern. Onwards and upwards - near term $55.00


Under the HOODEntry at : 52.05
Exit at : 42.58
Initial Target at : 53.93
Will Robin grab liquidity at equal high (EQL-H)?

Buying HOOD at $46, Long To 68, 80Great opportunity to buy HOOD if $47 or less...currently $46.
Buy shares and call options here!

$HOOD is not a Meme Stock.. Here's WhyHOOD may seem like the ultimate "meme stock", following in the footsteps of, and perhaps soaring past, the likes of AMC, BB, FUBO, and GME. But it's important to remember what unifies those other names -- short interest.
As far as we know, HOOD is not irregular in this factor. It's just a broker stock. If traders are sitting in HOOD shares on meme stock bets, it could be rough sledding ahead.

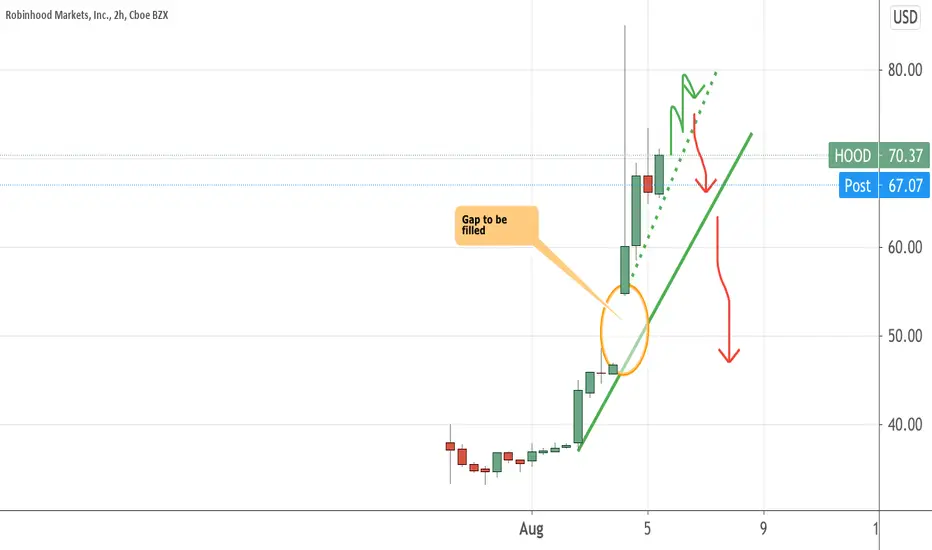
$HOOD 1h made a combo 13 after filling gapHolding above $49.27 would make an interesting swing long. The market is in a downturn so that chance of that is less likely. But it is on watch

hood lookin' like a longafter big price movement hood has been consolidating for the past 2 weeks. it is currently forming a bull flag/falling wedge price action. today just filled the gap left open from aug 4. usually after gap fills you tend to get strong support at that area. looking for a bounce from here.
-boosung

Update: Robinhood Mkts (HOOD) Up 8.9% Overnight. Bank 50% Here!Robinhood Markets (HOOD) Up 8.9% Overnight. Bank 50% Here.
Raise your stop-loss and let the balance run!!!

HOOD Long for nowCould we get a 50% gain in the next few days?
Breakout of bullish flag and MACD cross over.
Great risk reward