MASTERCARD Best buy entry now. Target $625.Mastercard (MA) has been trading within almost a 3-year Channel Up that only broke (but recovered naturally) during Trump's trade war. Still, the 1W MA100 (green trend-line) contained the downfall, as it always had.
Normally the Bearish Legs of this pattern tend to find Support on the 1W MA50 (blue trend-line), as the latest one did 3 weeks ago. Now that the price is trading still on the 0.382 Fibonacci retracement level, it historically is the best buy opportunity, as per all previous Bullish Legs.
The Channel Up has always priced its Higher High (top) on at least the -0.236 Fibonacci extension. As a result, we are targeting $625.00 before the year ends.
-------------------------------------------------------------------------------
** Please LIKE 👍, FOLLOW ✅, SHARE 🙌 and COMMENT ✍ if you enjoy this idea! Also share your ideas and charts in the comments section below! This is best way to keep it relevant, support us, keep the content here free and allow the idea to reach as many people as possible. **
-------------------------------------------------------------------------------
💸💸💸💸💸💸
👇 👇 👇 👇 👇 👇
1MA trade ideas

Mean Reversion Trade: MA1. RSI in oversold region
2. Price likely to rebound back the the mean
Trade Rules:
Entry Trigger - RSI has cross below oversold region, enter limit buy at close price
Exit Trigger - Close at market when close price cross above exit trigger (Red step line)

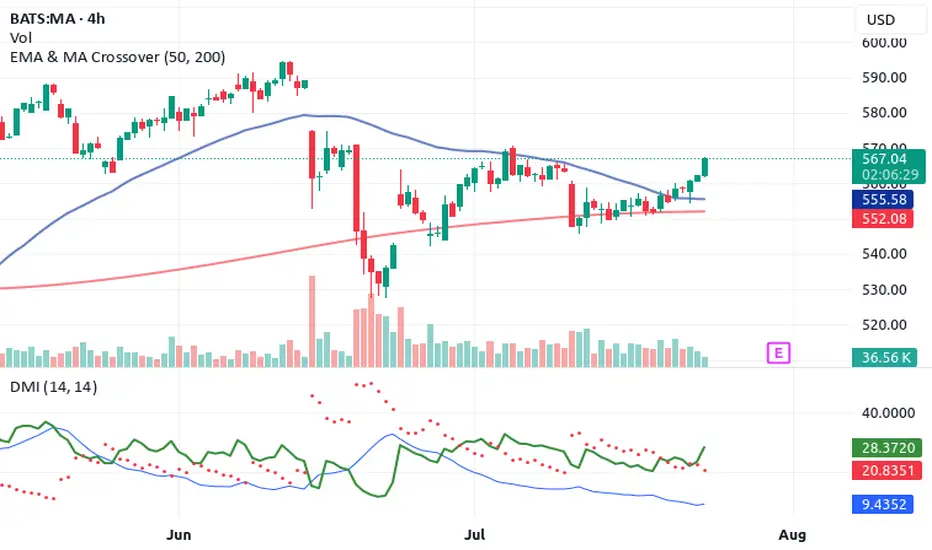
Top 4 Buy Signals Lighting Up Mastercard (MA) 🚀 Top 4 Buy Signals Lighting Up Mastercard (MA) | Rocket Booster Strategy
Mastercard Inc. (MA) is showing explosive potential, and it’s not just one signal—it’s a whole confluence of confirmations. When
you align this much market momentum, you don’t ignore it. Let’s break down how Rocket Booster Strategy gives us a powerful buy indication on the daily chart.
🔍 The Confluence Setup
✅ 1. DMI Buy Signal
The Directional Movement Index (DMI) is in bull mode. ADX is
rising and the +DI is firmly above -DI. This shows the trend is not just alive—it’s gaining strength.
🔻 2. Volume Oscillator Pullback
While Volume Oscillator is down, this is seen as constructive and not bearish. It suggests a quiet zone before the thrust—just like fuel loading before a rocket launch.
Smart traders know: momentum can build silently.
💥 3. Awesome Oscillator = Strong Buy
The Awesome Oscillator is green and firing hard. We’ve seen a clear twin-peak bullish formation followed by a break above zero
—classic acceleration sign.
🕯️ 4. Rising Window (Japanese Candlestick Pattern)
A Rising Window—a bullish continuation gap—has formed. This is one of Steve Nison’s top continuation patterns. It signals strong
institutional conviction in this trend.
📈 What Does This Mean?
When DMI, AO, candlestick patterns, and our own Rocket Booster Strategy all point up, it’s time to pay attention. This setup is rare—and high-probability.
🧠 Rocket Booster Strategy Recap
This strategy uses 3 momentum alignment points:
High Momentum Indicator (like AO) in Buy Mode
Pattern Confirmation (Rising Window or Engulfing)
Volume Correction Before Breakout (Fuel Before Fire)
When all 3 click into place, we have ignition.
🎯 Final Thoughts
Mastercard is looking primed for takeoff on the daily timeframe. Whether you’re an investor or a swing trader, this chart is
speaking loud and clear. But as always, risk management is your co-pilot.
✅ Add it to your watchlist.
🚀 Simulate entries.
🧠 Trust the confluence.
Rocket Boost This Content To Learn More
Disclaimer: This is not financial advice. Always use a simulation/demo account before committing real capital. Trade responsibly.
Mastercard Could Face ResistanceMastercard fell hard in June on the threat of stablecoin competition. Now, after a rebound, some traders may expect another push to the downside.
The first pattern on today’s chart is the selloff that began on June 13 when the Wall Street Journal reported that major retailers were considering stablecoins as an alternative to credit-card payment systems. Another drop came the following week after the U.S. Senate passed the GENIUS Act regulating stablecoins.
The stock recovered in the second half of June but it halted at the post-drop closing high of $569.45. Has new resistance emerged?
Third, prices could be stalling at the 50-day simple moving average. The 8-day exponential moving average (EMA) is additionally below the 21-day EMA. Those signals may reflect weakening intermediate- and short-term trends.
Fourth, stochastics have reached an overbought condition.
Finally, this month’s lower high could potentially represent the start of a new falling channel. Such a pattern could make investors expect a lower low closer to $500.
Check out TradingView's The Leap competition sponsored by TradeStation.
TradeStation has, for decades, advanced the trading industry, providing access to stocks, options and futures. If you're born to trade, we could be for you. See our Overview for more.
Past performance, whether actual or indicated by historical tests of strategies, is no guarantee of future performance or success. There is a possibility that you may sustain a loss equal to or greater than your entire investment regardless of which asset class you trade (equities, options or futures); therefore, you should not invest or risk money that you cannot afford to lose. Online trading is not suitable for all investors. View the document titled Characteristics and Risks of Standardized Options at www.TradeStation.com . Before trading any asset class, customers must read the relevant risk disclosure statements on www.TradeStation.com . System access and trade placement and execution may be delayed or fail due to market volatility and volume, quote delays, system and software errors, Internet traffic, outages and other factors.
Securities and futures trading is offered to self-directed customers by TradeStation Securities, Inc., a broker-dealer registered with the Securities and Exchange Commission and a futures commission merchant licensed with the Commodity Futures Trading Commission). TradeStation Securities is a member of the Financial Industry Regulatory Authority, the National Futures Association, and a number of exchanges.
TradeStation Securities, Inc. and TradeStation Technologies, Inc. are each wholly owned subsidiaries of TradeStation Group, Inc., both operating, and providing products and services, under the TradeStation brand and trademark. When applying for, or purchasing, accounts, subscriptions, products and services, it is important that you know which company you will be dealing with. Visit www.TradeStation.com for further important information explaining what this means.

Who will win? Crypto or Dollar?How Stablecoin Payments Can Hurt Visa & Mastercard
Bypassing the Interchange System
-Stablecoins allow peer-to-peer or business-to-consumer payments without using credit/debit card rails.
-Visa & Mastercard earn billions from interchange fees (0.1%–3% per transaction). If people pay directly via a stablecoin wallet (e.g. USDC, USDT), these fees vanish.
Faster, Cheaper Cross-Border Payments
-Traditional card transactions (especially international) can be slow and expensive.
-Stablecoins on blockchains like Solana or Ethereum L2s allow near-instant settlement with near-zero fees, reducing the demand for VisaNet and Mastercard systems.
Merchant Preference
-Merchants often pay 1–3% in processing fees to card networks.
-Accepting stablecoins directly = zero or minimal fees, increasing merchant pressure to move away from cards.
Fintech Adoption
-Companies like Stripe, PayPal, Shopify, and Square are integrating stablecoins.
-If these platforms offer cheaper stablecoin settlement options, users and merchants may shift away from traditional card use.
How Visa & Mastercard Could Defend or Adapt
Partner with Stablecoin Networks
-Both companies are already testing stablecoin payments:
-Visa is piloting USDC settlements on Solana and Ethereum.
-Mastercard partnered with Paxos and others to test blockchain-based settlements.
These moves show they're not ignoring the shift, but trying to build rails for stablecoins too.
Act as On-/Off-Ramps
-They can remain dominant as the entry and exit point between fiat and crypto (e.g. buying crypto with cards, or topping up crypto wallets).
-This maintains transaction volume even if some purchases happen in stablecoin.
Expand to B2B and API Infrastructure
-Visa and Mastercard are expanding into B2B transactions, open banking, and embedded finance APIs (e.g. Visa Direct, Mastercard Send).
-This diversifies revenue beyond retail card swipes.
Leverage Network Trust
-Stablecoins may lack consumer protection (fraud protection, chargebacks).
-Visa and Mastercard can market themselves as the trusted rails for consumers and businesses — especially in fraud-prone areas.
-Disclaimer: This analysis is for informational and educational purposes only and does not constitute financial advice, investment recommendation, or an offer to buy or sell any securities. Stock prices, valuations, and performance metrics are subject to change and may be outdated. Always conduct your own due diligence and consult with a licensed financial advisor before making investment decisions. The information presented may contain inaccuracies and should not be solely relied upon for financial decisions. I am not personally liable for your own losses, this is not financial advise.

Mastercard and Visa Shares Decline Due to Stablecoin BillMastercard (MA) and Visa (V) Shares Decline Due to Stablecoin Bill
Yesterday, we reported that the US Senate had passed the GENIUS stablecoin bill, which establishes a legal framework for regulating the stablecoin market. This development led to a sharp rise in the share price of cryptocurrency exchange Coinbase (COIN), while simultaneously putting pressure on Mastercard (MA) and Visa (V) shares.
According to media reports, market participants are concerned that stablecoins could pose serious competition to these companies, which earn revenue primarily from transaction fees. This serves as an example of how blockchain technology, with its low-cost features and high speed, could disrupt leaders in the traditional finance sector.
Technical Analysis of Mastercard (MA) Stock Chart
In May, MA shares formed an upward trend (shown in blue), but this was already broken by a strong downward move, accompanied by a wide bearish gap in the $575–$585 range.
Near the lower boundary of the channel, a contracting triangle pattern (shown in black) can be observed – this can be interpreted as a temporary balance between buyers and sellers. However, it didn’t last long: the widening spread of bearish candles (1 and 2) indicates growing selling pressure.
It’s possible that following a drop of over 9% from the June high, Mastercard (MA) shares might attract buyers betting on a short-term rebound. Nevertheless, in the longer term, developments related to the GENIUS bill could contribute to a continued downward trend.
This article represents the opinion of the Companies operating under the FXOpen brand only. It is not to be construed as an offer, solicitation, or recommendation with respect to products and services provided by the Companies operating under the FXOpen brand, nor is it to be considered financial advice.

A whole new type of cash back offer - LONG at 562.03I've posted ideas about MA before. I will continue posting buy ideas about MA until the final breath leaves my body. The average credit card APR is 24.3% - I think this trade can do better. Around 60% APR on average, with a good chance at 270%+ APR.
MA is in a multi-year uptrend, only 2 days removed from its all time high. Smoked today not because they lost their CEO or their business model is a failure, but because two historic enemies took shots at each other halfway across the world. While I won't completely ignore geopolitics, its effects are almost always transitory. I literally can't find a better reason to buy this as a short term blip in their long term story.
On a day where, when the whole market fell just over 1%, MA fell 4x that. I will take that gift and run wild with it. Historically, MA has never failed to produce a profitable trade for me, with an average gain of +.24% per trading day (that's 60% annualized). The average trade length has been 7 days and gained 1.7%.
However, using an additional filter, the per day returns for the last 25 trades have increased to +1.07% per trading day (270% annualized). That's 4x the old returns and almost 25x the long term average daily return of the S&P 500. The average trade length has shortened to 5.5 trading days and produced an increased average return of 2.45% as well.
Additional lots may be added if the signal is re-triggered before I close it. There is no specific profit target, but I will redeem my cash back offer and close any lot end of day when an exit signal is triggered and the lot is profitable.
As always - this is intended as "edutainment" and my perspective on what I am or would be doing, not a recommendation for you to buy or sell. Act accordingly and invest at your own risk. DYOR and only make investments that make good financial sense for you in your current situation.

MA another financial cup and handleMastercard is another name in the financial sector that is showing a cup and handle formation on the daily chart. Two price targets to break at $585.60 and the ATH of $588.45 and it's off to new highs.

Mastercard: Approaching the Top of Wave BMastercard has rebounded after a brief cooling period, and we now expect turquoise wave B to complete just below resistance at $620. Once that top is in, wave C should drive a meaningful retracement, ending with the low of magenta wave (4). Alternatively, if turquoise wave alt.(4) has already bottomed — which we estimate as a 40% probability — then a direct breakout above $620 would suggest a shift toward a much more aggressive advance. That path would take the stock straight into magenta wave (5), completing blue wave (I) with a strong rally.
📈 Over 190 precise analyses, clear entry points, and defined Target Zones - that's what we do.

Market sentiment remains bullish**Direction:** **LONG**
**LONG Targets:**
- **T1 = $562.00**
- **T2 = $572.00**
**Stop Levels:**
- **S1 = $540.00**
- **S2 = $525.00**
---
**Wisdom of Professional Traders:**
This analysis synthesizes insights from thousands of professional traders and market experts, leveraging collective intelligence to identify high-probability trade setups. The wisdom of crowds principle suggests that aggregated market perspectives from experienced professionals often outperform individual forecasts, reducing cognitive biases and highlighting consensus opportunities in Mastercard Incorporated.
**Key Insights:**
Mastercard (MA) has maintained significant strength in its current uptrend, supported by robust financial performance and strategic initiatives in digital payments and financial technology. Market sentiment remains bullish, with continued optimism around MA's expansion in new payment solutions and regions. Additionally, payments industry tailwinds and increased adoption of new technology create favorable growth conditions for Mastercard in both developed and emerging markets. Analysts point to Mastercard's innovative payment offerings and increasing cross-border volume as a key driver for continued upward momentum.
**Recent Performance:**
MA has gained approximately 2.8% in the past two weeks, reflecting robust demand within a challenging macroeconomic environment. The stock has outperformed benchmarks in the payment solutions sector and has seen consistent volume near key levels. A combination of steady institutional buying and strong quarterly reports underpins its recent performance, signaling strong investor confidence.
**Expert Analysis:**
Analysts remain broadly optimistic about MA's prospects. Several have revised their price targets upward to values exceeding $570, reflecting confidence in Mastercard's leadership in payment innovation. The company’s strong financial performance and stable revenue growth show resilience within the global payment ecosystem. Its partnerships with fintech firms and continued investment in digital transformation are expected to drive even stronger market positioning going forward.
**News Impact:**
Recent partnerships with financial institutions and fintech firms, along with Mastercard's enhanced cross-border payment offerings, have fueled positive sentiment. Additionally, strong quarterly earnings and optimistic guidance have underscored its market competitiveness, boosting investor confidence heading into next week. Mastercard’s ability to adapt to market dynamics and deliver shareholder returns has positioned it strongly relative to competitors.
---
**Trading Recommendation:**
Considering the strong technical and fundamental outlook, along with positive trader sentiment and growing institutional interest, a LONG position for Mastercard Incorporated presents a high-probability opportunity for growth. This recommendation is based on its proven financial stability, leadership in innovation, and solid market performance projected for the short term.
```

MA is below 200MAMA is showing a peak and likely to stay bearish toward the 430 level. It's currently below the 200 MA, indicating a loss of momentum.

MASTERCARD: One more dip possible but long term target is $620.Mastercard is neutral on its 1D technical outlook (RSI = 52.317, MACD = -0.060, ADX = 29.709) having just recovered its 1D MA50 following the March 13th rebound. The pattern here is a Channel Up and March's bearish wave already hit the 0.382 Fibonacci retracement level much like the previous one did on May 1st 2024. That however went on to extend the decline to close to the 0.5 Fibonacci level and hit the 1D MA200. Consequently there is a chance of one more month of slow decline to the 1D MA200 but overall, this is a good enough level to buy again for the long term and aim for the -0.382 Fib extension (TP = 620.00).
## If you like our free content follow our profile to get more daily ideas. ##
## Comments and likes are greatly appreciated. ##

MA Stock: Support at $500-$510 after short-term pullbackMA stock's short-term momentum has weakened after pulling back from its all-time high of $582.23. However, its long-term and intermediate trends are still intact. The $500–$510 range, supported by the 200-day moving average, is an important support level for keeping the intermediate uptrend. If this level holds, MA stock could reach $630–$680 by the end of 2025.

MASTERCARD: Despite the CRASH!, good graph!! Attention!!
On January 30, the American payment services provider Mastercard presented results that far exceeded forecasts.
It earned 12,874 million dollars (12,351 million euros) in 2024, 15% more than the previous year. Net income reached 28,167 million dollars (27,023 million euros), 12.2% more.
Meanwhile, operating costs reached 12,585 million dollars (12,074 million euros), 13.5% more.
Mastercard CEO Michael Miebach commented on the results: “This quarter we have achieved good results, with net income growth of 14%, or 16% without taking into account currencies.”
He continued: “Our diverse capabilities in payments and services and solutions, including the acquisition of Recorded Future this quarter, set us apart and position us well for long-term growth, as we outlined at our investor day.”
-----------------------------------------------------------------------
---> What does it look like technically?
DESPITE THE STOCK MARKET CRASH we are immersed in due to the TRADE WAR, if we look at the chart, the trend is still clearly bullish and has not yet broken ANY important support that would put it in danger, therefore, EVERYTHING INDICATES THAT WE ARE FOUND WITH A GREAT OPPORTUNITY TO GO LONG, since the market has fallen a lot and it is logical to expect an upward correction in the next few days of the SP500 index, which will logically support the rise in the price of Mastercard.
Furthermore, the price today touched the 61.8% Fibonacci and respected it (DESPITE THE CRASH), which gives us another clue that the area is respected and is possibly the floor of the next bullish impulse.
--------------------------------------
Strategy to follow:
ENTRY: We will open 2 long positions if the H4 candle closes above 553
POSITION 1 (TP1): We close the first position in the 575 area (+4%)
--> Stop Loss at 530 (-4%).
--> Ratio 1:1
POSITION 2 (TP2): We open a Trailing Stop type position.
--> Initial dynamic Stop Loss at (-4%) (coinciding with the 530 of position 1).
--> We modify the dynamic Stop Loss to (-1%) when the price reaches TP1 (575).
-------------------------------------------
SET UP EXPLANATIONS
*** How do you know which 2 long positions to open? Let's take an example: If we want to invest 2,000 euros in the stock, what we do is divide that amount by 2, and instead of opening 1 position of 2,000, we will open 2 positions of 1,000 each.
*** What is a Trailing Stop? A Trailing Stop allows a trade to continue gaining value when the market price moves in a favorable direction, but automatically closes the trade if the market price suddenly moves in an unfavorable direction by a certain distance. That certain distance is the dynamic Stop Loss.
-->Example: IF the dynamic Stop Loss is at -1%, it means that if the price drops by -1%, the position will be closed. If the price rises, the Stop Loss also rises to maintain that -1% in the rises, therefore, the risk is increasingly lower until the position becomes profitable. In this way, very strong and stable price trends can be exploited, maximizing profits.

Mastercard Doing a 180. MAI called tops too early last time I looked at Mastercard. That's why you have stop losses.
It is a common feature I found when using Elliott, that there is frequently one subwave that is left unaccounted for, causing one to call pivot prematurily.
But calling pivot is never easy no matter, which tactic you use. Similarly, vWAP derived reversal to mean strategies often fail, as well as many of Jurik (and others -not singling anyone out) indicators that can be used for this purpose.
In my experience, it almost does not matter what you use, as long as you are the master of your system. Reading an indicator is easy, but reading what is between the lines is what creates real profit. Mechanical interpretation of squiggly lines does not lead to profits in the long run.

The End of Visa and Mastercard: A New Era for Payments in EuropeBy Ion Jauregui – ActivTrades Analyst
The payments landscape in Europe could change dramatically if the project for a payments platform independent of Visa and Mastercard takes hold. The interconnection between Bizum and Wero, with the backing of the European Central Bank (ECB), paves the way for a sovereign alternative that could displace the US giants. But how would this impact European consumers, merchants and banks?
Towards European Financial Sovereignty
For years, the ECB has been pushing for a unified payments system to reduce dependence on foreign providers. The growing concern for financial sovereignty intensified after the sanctions on Russia and the exclusion of banks from the SWIFT system, demonstrating how payment infrastructure can become a geopolitical tool. In the current situation with a US government rather reluctant to collaborate with a Europe with a mostly center-left government team, this situation looks like another scenario that the European commission would like to avoid, a scenario of a foreign country imposing tariffs on high-need banking services. With the alliance between Bizum, Bancomat Pay (Italy) and SIBS (Portugal), and the integration with Wero, Europe could finally have a pan-European system for digital payments, reducing costs and ensuring greater security.
Consumer and Merchant Impact
If Visa and Mastercard were to disappear from the European payments ecosystem, consumers would have to migrate to European cards and digital wallets. This could initially create friction for international merchants that rely on global payment networks, but in the long term would offer more competitive rates and smoother transactions within the EU. The challenge would be global acceptance of these new solutions. While European platforms could dominate the domestic market, the lack of agreements with merchants outside the region could limit their functionality for international travel or purchases. So, although it is a long-term European solution, at this stage it does not appear to have much depth at the moment in the eyes of Visa or Mastercard, the two largest service providers in the West. Another plausible paradigm would be for the Brics environment, in Latin America, Africa and the Middle East, to adopt this new European service, which could facilitate the diversification and competitiveness of this new ecosystem.
Implications for Banks and the Financial Industry
For European banks, the elimination or reduction of cards from Visa and Mastercard providers could result in greater independence and control over transaction fees. However, banks will have to invest significantly in adopting this infrastructure and ensuring its compatibility with other payment systems. On the other hand, fintechs and neobanks could take advantage of the transition to capture customers with innovative payment services, accelerating the digitization of the sector. Companies that pivot between the UK and Europe and are of this nature will probably have to adopt this service, so the UK will have to end up linking this service if it wants its customers to use cards in this region if this happens.
Is a Blocking of North American Services Viable?
Although the possibility of a blocking of US payment services by European banks is speculative, it is not impossible. The creation of a fully independent European payments ecosystem could be seen as an economic protection measure, but it could also generate trade tensions with the US.
Europe faces a crucial decision: remain dependent on global payment leaders or build its own financial giant. The outcome of these negotiations could redefine the way millions of people manage their money in the future.
Technical Analysis VISA(Ticker AT: V.US) /Mastercard (Ticker AT: MA.US)
If we look at both companies they have performed quite similarly. Both have had a very strong upward momentum since January 13 with the new Trump administration, causing them to break out of the sideways range of late November last year with a boost from annual earnings expectations. And following the earnings release the share price of both companies has soared with similar “hype”. At the moment with a pessimistic market there has been a relatively strong correction of -4.80% for Visa and -5.31% for Mastercard placing them at 352.54 and 558.30 respectively. At this moment they are located in a similar price consolidation zone, the crosses of averages continue to indicate price expansion, RSI has reduced its overbought to 56.72% and 50.15% respectively. Although the former has its bell shaped triple and the strongest demand is located in the previous sideways range between $290 and lows of $252 and its control point (POC) around $276. The second has a double bell configuration with its POC around $527 above the previous range. So the outlook for Visa on a technical level looks slightly lower than Mastercard, although in both cases it currently looks like one of the winners in the market on a long term perspective.
*******************************************************************************************
The information provided does not constitute investment research. The material has not been prepared in accordance with the legal requirements designed to promote the independence of investment research and such should be considered a marketing communication.
All information has been prepared by ActivTrades ("AT"). The information does not contain a record of AT's prices, or an offer of or solicitation for a transaction in any financial instrument. No representation or warranty is given as to the accuracy or completeness of this information.
Any material provided does not have regard to the specific investment objective and financial situation of any person who may receive it. Past performance is not reliable indicator of future performance. AT provides an execution-only service. Consequently, any person acing on the information provided does so at their own risk.

I Am Sorry! Here Is a LessonI usually put out a single trade every day prior to markets opening. I do it because it is a fun way for me to share my trading knowledge with others for free. It is also a great way of journaling my thoughts. But I should have been better for all of my followers. The truth is markets have been kicking my ass since late December.
In a normal bull market, my trading strategy is to shoot first and react fast. I enter trades on price action after the Keltner channel is hit and pullback occurs. This can be on first entries, second entries, inside bars or even a complex pullback. Once in a trade I reduce risk quickly or exit a bad trade swiftly. Hence, "shoot first and react fast".
Markets were changing and I saw it, a repeatable pattern. I wanted to write an article before the market changed up but, never got the chance. More and more stocks were entering complex pullbacks. I believe I mentioned it in passing in some videos but never explicitly logged it anywhere. When we are seeing a lot of complex pullbacks in the broader markets it means that something is changing, pullbacks are going deeper. What was once strong is now weakening and that was happening before our eyes. I will link the complex pullback video and articles to this article for your viewing pleasure.
Today, I just went through all of my losing trades for last month and all of them had one thing in common. Not waiting for the right entry. The cycle low entry. In a pure bull market getting in on price action alone is completely sufficient but, with so much uncertainty everywhere, now more than ever we need to be selective. In steps the stochastics indicator...
The apology is a simple reminder to me that markets are tough, and real money is on the line. While I am providing the best information I can with the information I have at the time, it may not always be correct. That is why I don't offer signals and instead opt for trading ideas. Funny thing is, I think a lot more of my one good trade ideas beat out my other personal trades. Regardless, I hope you take this article and learn something from it. I know I have. The last thing I will leave you all with is this MA chart with annotation that is currently playing out. These will be the types of trades that I look for until further notice.
Good Luck and Good Trading.
~ JoeRodTrades

Mastercard Curving Back Down. MAAnalyzing price action here for a suspect pivot on Mastercard. A 5 wave impulse is done, a part of a much larger structure, now crossing MIDAS curve after a tight trading range.
Tight trading ranges inevitably lead to squeezes, and this might be a breakout to the downside in the last two candles. Ehlers is especially telling here, as it clearly indicates a divergence all the way through the tight trading range, which is a bearish sign on its own.
Fourier smoothed VZO plus offset trigger is generally bearish but less revealing otherwise. Bollinger Band %PCT just flipped and is expected to go lower with the most recent bearish price action

$MA Triangle BreakoutNYSE:MA breaking to the upside of the triangle pattern. If you are swing trading this setup, the technical stop loss and trade support sits around the $550/$551 area. With MA at ATH, the opportunity exists for a 2:1 reward (or better) if this momentum to the upside continues. Plenty of time before earnings for this swing trade to work out.

Mastercard outperforming the US markets with more upsideMastercard is definitely one of the outperformers in 2025,
Strong Financial Performance: Mastercard exceeded earnings and revenue expectations due to robust holiday consumer spending.
Growth in Payment Volumes: Increased transaction volumes, especially cross-border, boosted revenue growth.
Strategic Acquisitions: The acquisition of cybersecurity firm Recorded Future enhances its digital security offerings and services.
Positive Market Sentiment: Analysts raised price targets, reflecting confidence in the company's growth prospects.
Technicals are also looking super.
Price>20 and 200
Rev Cup and Handle
Target $610.86

Bullish upside comingThe formation of the larger falling wedge is pointing toward a potential reversal pattern ahead and though MACD is showing a downtrend, the price chart selling was rather weak hence, I would think that the upside is coming. Price action-wise, the bullish engulfing on Tuesday was followed through with higher prices on Wednesday itself before the market closed for its Trading holiday. This signals confidence in the bullish pressure for the stock.
Indicator wise, stochastic oscillator is showing crosses above the 20-level, indicating momentum building up. ROC has broken above the zero line.
Maintain buy at spot at 448.18 or pullback to 439.87.

Long MA at 511.38 - pullback in an uptrendMA has been an excellent stock to trade with my system, producing one of the highest returns per day held of any megacap stock at .23%/day held (58% annualized) spanning over 400 real and backtested trades. The average holding period is 7 days and the max lots held at any time in the last 17 years would have been 10. It tends to pay off well and pay off quickly.
It is currently trading just off its 6 month high, set on 12/26 and in the middle of a solidly uptrending regression channel. None of those things guarantee success, but trading is about putting the odds in your favor, and this setup is about as good as it gets in that regard.
Initial lot was purchased just before the close today at 511.38
Per my usual strategy, I'll add to my position at the close on any day it still rates as a “buy” and I will use FPC (first profitable close) to exit any lot on the day it closes at any profit.
As always - this is intended as "edutainment" and my perspective on what I am or would be doing, not a recommendation for you to buy or sell. Act accordingly and invest at your own risk. DYOR and only make investments that make good financial sense for you in your current situation.

MASTERCARD Huge sell signal emerged, hit 1D MA50 after 4 months.Mastercard (MA) has been trading within a 2-year Channel Up that has given us very accurate trades. Our previous signal (April 02, see chart below), was a sell right on the pattern's top that easily hit our $440 Target:
Once more we see a long-term Top on this stock as the price almost priced a Higher High and on yesterday's Fed fueled pull-back, it hit its 1D MA50 (blue trend-line) for the first time in 4 months (since August 06).
Apart from that, the 1D RSI has been on a Bearish Divergence of Lower Highs (against the Higher Highs of the Bullish Leg/ dotted Channel Up) since October 18. All such previous Bearish Divergences within this 2-year Channel Up, have started the Bearish Legs (red ellipses) of the pattern, which hit at least their 0.382 Fibonacci retracement levels.
As a result, we have a high probability short signal at our hands, targeting $495.00 (Fib 0.382).
-------------------------------------------------------------------------------
** Please LIKE 👍, FOLLOW ✅, SHARE 🙌 and COMMENT ✍ if you enjoy this idea! Also share your ideas and charts in the comments section below! This is best way to keep it relevant, support us, keep the content here free and allow the idea to reach as many people as possible. **
-------------------------------------------------------------------------------
💸💸💸💸💸💸
👇 👇 👇 👇 👇 👇
