Double TopMcDonald's share price is drawing the company's logo on the chart, which is a potential Double Top trend change figure. If the support area of 250.00 is broken, the potential for a fall to 200.00 will open up.
There have been three similar situations of this magnitude in the history of the company. All of them realized a 30-60% drop, i.e. they were senior corrections.
1MCD trade ideas

Good Time To Buy MCD??Reasons To Invest In McDonald's
Long-Term Bullish Trend: The overall long-term trend for McDonald’s stock is bullish, indicating strong growth potential.
Support at 200 SMA on Weekly Chart: The stock has pulled back to the 200-day Simple Moving Average (SMA) on the weekly chart, a key support level.
Historical Price Bounce: McDonald’s stock has bounced at this price level twice before, showing a pattern of support.
Monthly RSI at Pandemic Lows: The Relative Strength Index (RSI) on the monthly chart is at levels not seen since the pandemic, suggesting it might be oversold.
Low Weekly RSI: The RSI on the weekly chart is also low, indicating a potential buying opportunity.
Bullish Divergence: There is bullish divergence on both the daily and weekly charts, which can signal a reversal or continuation of an uptrend.
Bearish Monthly Candles: There have been four consecutive bearish monthly candles, so a move higher is more likely as the stock may be due for a rebound.
Potential for 20% Gain: A return to the all-time high would result in a 20% gain from the current price.


McDonald's Elliott WaveHello friends
In McDonald's stock, we see the formation of a 5-wave impulse pattern that has been completed. These 5 waves can be considered as wave A or 1. Now, with the break of the trend line at the end of wave 5 and the retreat towards it, we expect the price to rise to the $262 range. This increase can occur in the dominance of a zigzag or any corrective pattern. Stop loss can also be considered at 245 which is an important support.
The second target of the $280 range can be considered.
Be successful and profitable.
To support me, I recommend you install Trading View software on your phone and see my analysis and support me with your comments and Boost. Be successful and profitable.


MCD time for CALLS again we now have a nice daily RSI positive non confirmation I will now buy 260 calls looking for a rally of 11 to 15 $

MCD Short IdeaMCD recently put in a double top near ATH and had a big rejection. It also broke below a major trendline dating back several years. For shorter term, I'm watching this descending trendline and horizontal resistance for a short entry.

MCD correction doneI expect MCD to hit $269 by 7/19. $269.63 is the .382 retrace level off the 302 high and 249.38 low. Show's a double bottom with fib timing on the daily. I am in the 9/20 $260 calls for $7. other targets above: 275/291/316

MCD, 200 sma on the weekly BIG Support!! One could buy shares long term, or put sales or bull put spreads *once / if* MCD gets down into the $244 price zone.
Gonna be super boring. But overall, likely profitable. MCD hasn't hit the 200 sma(on adjusted for dividends) chart since covid. When it bounced very hard.
:-)


The Golden Arches at a Technical Crossroad .McDonald's Corporation (NYSE: MCD), a stalwart in the fast-food industry, is currently navigating turbulent waters. As of the latest market close, MCD is priced at $253.70, reflecting a slight dip in the pre-market at $253.44. The stock's technical indicators and recent price action suggest a critical juncture, providing both potential risks and opportunities for traders and investors alike.
MCD's price action is currently showing signs of bearish pressure, as evidenced by the recent downturn in the stock's weekly candlestick pattern. The closing price of $253.70 positions the stock just above its immediate support level of approximately $252.80. This level is crucial as it marks the lower boundary of the recent trading range and could serve as a pivot point for future price movements.
Relative Strength Index (RSI): With an RSI of 33.82, MCD is approaching oversold territory. This typically signals that the stock may be undervalued and could be due for a bounce. However, caution is advised as RSI alone isn't a definitive buy signal.
Short-term MAs (10, 20, 30-day EMAs and SMAs) are all indicating a bearish trend as they align above the current price, suggesting downward pressure.
The 200-day EMA at 253.41 is acting as a key support level. A sustained break below this could open up further downside risks.
MACD: The MACD level at -6.86 indicates a bearish momentum, as the signal line is positioned below the MACD line, reinforcing the downtrend.
The momentum indicator at -12.99 shows a bearish outlook, yet the proximity to oversold levels hints at a potential reversal if buying interest materializes.
Stochastic Oscillator (%K at 14.74): Suggests a buy signal as it indicates the stock is oversold and could be due for an upward correction.
The weekly chart reveals a clear downtrend with lower highs and lower lows forming since the peak earlier in the year. This bearish pattern is compounded by the stock trading below the Ichimoku cloud, which typically suggests continued downward momentum. The volume profile shows a decline in buying interest, as seen by the diminishing green bars, underscoring the selling pressure.
Recent news highlights a mixed sentiment towards the fast-food sector. Despite inflationary pressures and shifting consumer preferences, McDonald's has shown resilience in its financial performance. The latest earnings reports indicate steady revenue, but the market remains cautious amid broader economic uncertainties.
Support Levels: Immediate support lies at $252.80, followed by stronger support at the $250 psychological level. A break below these levels could accelerate the downward movement towards the $245.00 - $240.00 range.
Near-term resistance is seen around $260.00, aligning with the 20-day SMA. A breach above this could signal a short-term bullish reversal, targeting the $270.00 - $275.00 range.
Trade Recommendation
Short-Term Long Position:
Entry: Consider entering a long position if the price rebounds off the $252.80 support level with confirmation (such as a bullish candlestick pattern or increased volume).
Target: Aim for the $260.00 resistance level, with a potential stretch goal to $270.00.
Stop Loss: Place a stop loss below $250.00 to protect against further downside.
Short Position:
Entry: Enter a short position on a decisive break below $252.80 with strong volume.
Target: Look for a move towards $245.00, and further to $240.00 if the bearish momentum persists.
Stop Loss: Set a stop loss above $255.00 to mitigate risk if the breakout fails.
While McDonald's (MCD) is teetering on the edge of critical support, its near-oversold status presents a potential short-term buying opportunity. However, traders should remain vigilant for further bearish developments that could lead to additional downside. The interplay of these factors makes MCD a compelling candidate for both long and short strategies in the upcoming sessions.


McDonalds in potential rising channelMcDonalds could be in a potential rising or sideway channel. What is your thought?

Great food, Great stock. Bottom of regression trendMcDonald's Corporation is an American multinational fast food chain, founded in 1940 as a restaurant operated by Richard and Maurice McDonald, in San Bernardino, California, United States.

Ammunition park at 206 price level for MCD stockNo hurry, awaiting for this stock to come own to this level - 206 to 218 to consider going LONG

MCD on the uptrend on a weekly chart. Go Long.MCD on the uptrend on a weekly chart. Go Long. This analysis is for informational purposes only.

MCD Breakdown?MCD appears to have broken down from a significant trendline going back to Feb '21.
Potential target levels displayed by orange lines. Theoretically could retrace to as low as Feb lows.

MCDONALDS WILL GO FURTHER DOWNSIDE WITH THIS PATTERNMCD has formed a bearish flag pattern, suggesting a potential decline towards the daily support level. It's prudent to await confirmation of a bearish breakout from the flag pattern before considering any further action.

MCD: Long-Term Investment
Technicals :
MCD has bottomed....
Ichimoku Cloud Twist and breakout!
Bullish G-TAZ
ADZ bullish

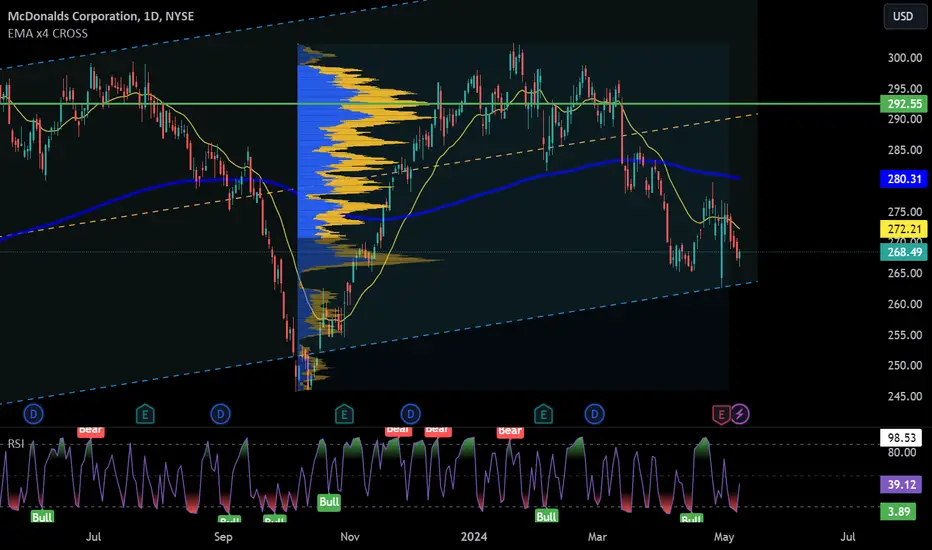
MCD BUY BUY BUY....never see againconfirming my latest analysis on the stock, the price tested the volumetric support of the HVA (High Value Area), bouncing on the 267.13 level. In my opinion, this level, so interesting, we may never see again.
MCD eyes on $269: MickeyDee's needs to bounce hereMCD has been retracing from $300.
Now at a major support around 269.
Strongest support above the 250 area.
$ 268.98 - 269.67 is the exact zone of interest.
$ 250.05 - 251.41 is the next strong support below.
$ 273.05 - 274.41 is the immediate resistance above.
===============================================

MCD LONG : GREAT LONG FOR A GREAT RRR
From a technical point of view, the bullish channel that I am sharing, has been faithfully mainteined by the price, since 2018 (except for the covid crisis which catalyzed an historical volatility much greater than the average volatility of the stock). The current price, compared at revenue, it is definitely interesting. In a context of increasing volatility, holding a defensive stock like MCD could be a winning opportunity in the portfolio

MCD Taking a biteNYSE:MCD Multi-timeframe analysis indicates strong momentum on to the upside giving a higher probability that a trend reversal could be in play.
On the daily, we see short term bullish price action confirmed by volume (denoted by the highlighted circle. These charts in combination allows us to initiate a trade to the long side.
