3M possible shortPlaying Trading Simulator Game:
If it gaps down (opens lower than yesterday's close) we may get panic selling, which will drive the price down.
1MMM trade ideas

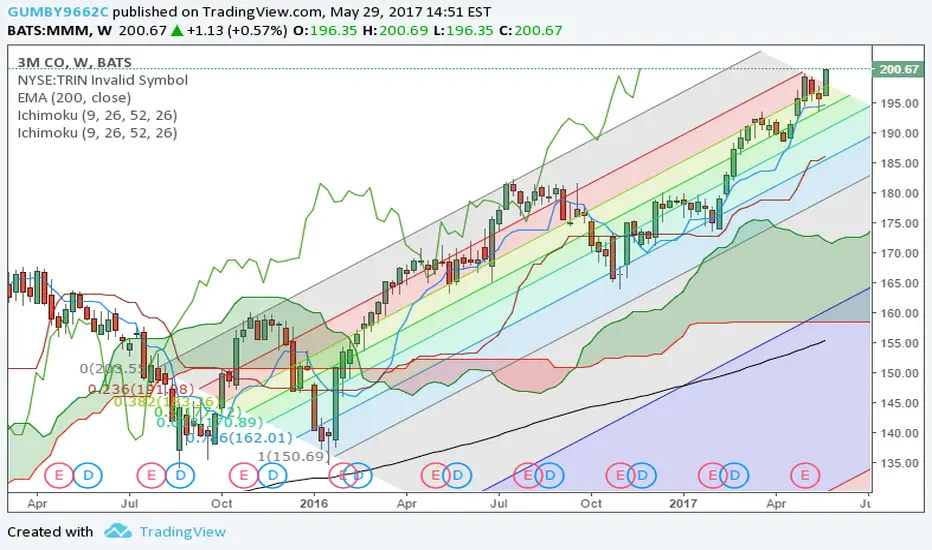
3M aimed at 242Just like on many other stock charts, the 3M has begun a decline because of encountering a resistance line of a long term trend (yellow line). The trend is best observable on the weekly chart.
(Too bad that the resulting decline in a short term channel down pattern (black lines) erased the profits created by the beat earnings.)
Before you read on, note that I am biased, because I like the fundamentals of the company. Their stuff is one of the type of products that nobody talks about but everybode uses and will use.
So in regards to the technicals of the charts. The pair got to the previously mentioned massive resistance by going in a medium scale ascending wedge. Yes, I know that they are rare and usually those are bad drawn channels, but this thing had wedges, that have created a large parabolic advance. An advance that should have eventually create a descent.
Initially I expected that there will be a retracement later on, but Trump's memo has caused a sell of and so the retracement has begun. In general we have a short term channel, which is aimed to reach the support of the medium scale wedge. The support is located at the 242.00. I will be watching that level to see whether we will have another attempt at the yellow line and a half a month surge, or the stock will drop to reach for new low levels and form a new medium scale pattern.
However, there is one interesting aspect that keeps bugging me in the back of my head. Look at the horizontal line at 245!!! It provided support before the earnings call, and the price ended the session at that level on Friday.
I tried drawing fibos with various low and high levels or find any other justification, why did someone kept buying at that level and kept the price up, but failed. If anyone has any input in regards to that level, please send a PM or better yet, post a comment.
Yours sincerely,
Y
P.S. marking the idea as long, because I am still staying long at the time of writing. However, will notify, if I close up the position. (It would occur, if the 242 is passed.)


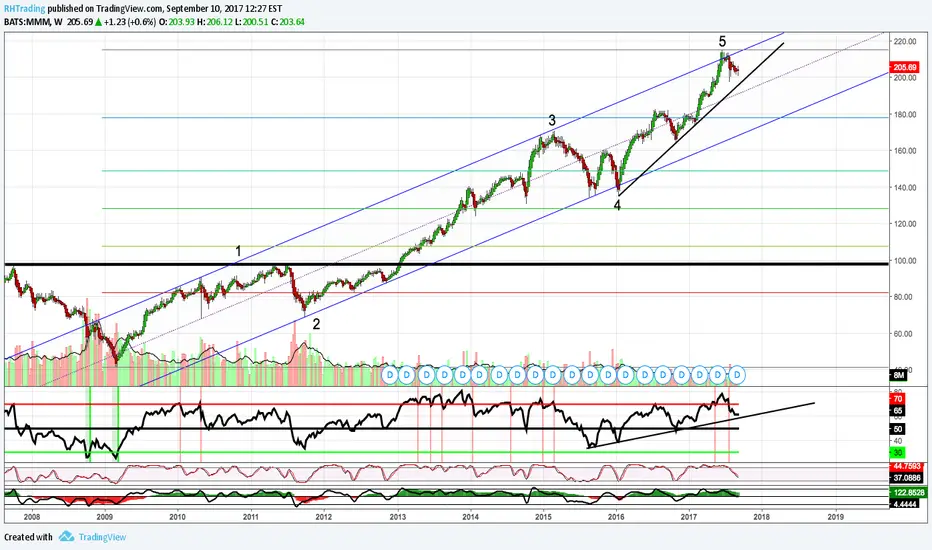
3M - RSI divergenceYou wouldn't short a preferred; you would buy it.
Good chance to enter one of the best industrials out there.
What I see is technical correction and then up. I'm only trading the latter though.


October outlook for MMMI like the heavy volume comming in, going to get in above purple line. Want to see it move a bit sideways then break with strong candle.


3M, Good time to buy or just getting started?3M's earning report came up a bit short, however they have had continuous growth. Looking at this trend in the long term I believe we've hit a temporary top. I believe we will test sub $190 prices before we potentially continue the bull trend. I also don't think it's unreasonable for it to tap $175-$180 although I do think that's unlikely.
I would look to go long around the $185 mark with a target of $205, it could hit $225 if trend continues.

Breakout ahead?2214,75 is the Level to watch. Above that Level a stoppbuy could be installed --> tp 20/222

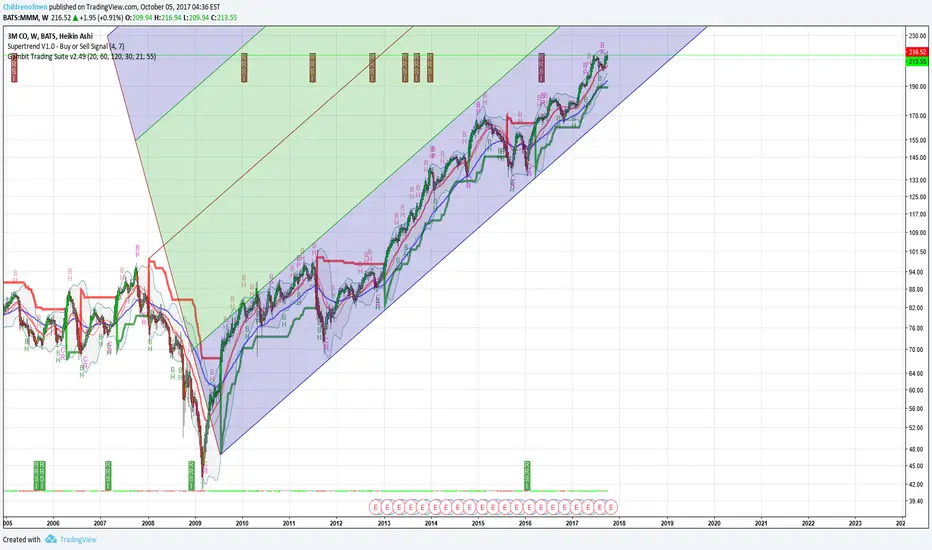
MMM (3) Consolidation finished?Last Friday, MMM (daily and 1' charts) seems to have finished a "Minute"-wave 4 correction as a "Running ZigZag". Next 1,618 Target = 211,68 for Monday and 219,65 for the coming 2 weeks.


$MMM rally into thin air$MMM rally into thin air but ABCD completed ..Short zone here upto upper bb and rising resis line.