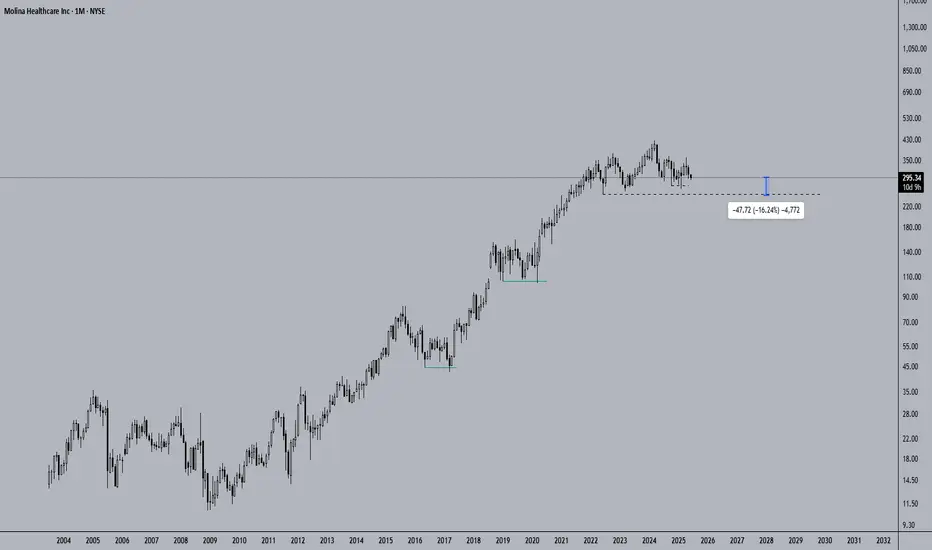
Oooh MolinaMolina has a safe and clean looking chart. I don't see price getting much below the marked level of ~$250, if it even goes there.
The longer it consolidates the lesser the chance of price going there which I think is already the case here (as the consolidation 'washes' out the strength of the downtrend).
From here to $250 is a ~17% drop, meaning low risk meaning higher position size.
As always no investment advice, but I see this platform a bit like my investment diary so you already now what I'm going to do.
1MOH trade ideas
Confirmed, didn't beat the last high, it's a BOSThis is a high candidate for reversal if there ever was, seeing it come down, maybe diligently per company operations, or panicking if there isn't. Either way, looking for a correction after entering.

Bullish continuation NYSE:MOH is looking at a bullish continuation after the stock saw a break above the falling wedge formation, confirming the upside continuation over the longer-term period. Strong bullish break above 340.00 further confirms the upside.
Long-term MACD is looking at a strong long-term bullish momentum after the MACD/signal line is rising and histogram is positive.
Stochastic has been rising and is in a steady state, indicating strong bullish momentum in the mid-term.
23-period ROC is rising and staying above the zero line. Directional movement index is strong bullish.
Ichimoku is strong and has confirmed a three bullish golden cross

MOH long term potentialMOH has corrected nicely after a huge run. This is a stock that a few legendary investors have added as of late. If you expect medicare/medicade expenses to increase by 7% on average, and more people to sign up over time, this stock will hugely benefit. I note a basing at the most recent fib level. The weekly stochastic is resetting and the BBWP is indifferent. I expect a retest of 370$ rather quickly. This stock will also perform well if we get recession fears or other macro negative news.


$TDY with a bullish outlook following its earnings #StocksThe PEAD projected a bullish outlook for NYSE:TDY after a positive under reaction following its earnings release placing the stock in drift A with an expected accuracy of 80%.

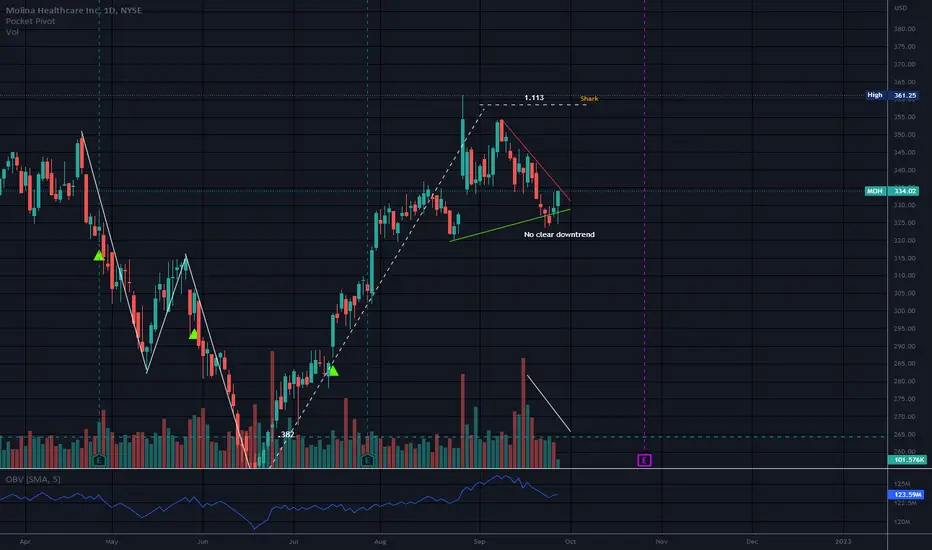
$MOH longCheck out the price action in this chart!
We’ve perfectly corrected the last upward impulse and landed at the 61.8% Fibonacci retracement.
The price is supported by a horizontal support cluster .
On the last trading day, the price tested the 50-day SMA precisely.
So, IF last day's high and the 30-day SMA are broken to the upside, I expect the next bullish impulse to begin.

MOHMolina Healthcare, Inc. is a managed care company headquartered in Long Beach, California, United States. The company provides health insurance to individuals through government programs such as Medicaid and Medicare.
High risk, but very healthy price action with $385 as a pivot.

MOH with a cup-with-handle patternFundamentals :
Not the best and not the strongest of my screens, but relatively ok.
Technicals :
The only reason why I am taking this trade is because of the cup-with-handle pattern. I am letting that guide me for now despite the not-so-good fundamentals.
The trend is up...
Only risking a tiny 0.1%...

Symmetrical Triangle/HealthCareNeutral until broken with a trend in that direction. The resistance/red or support line/green must be broken.
Orange type are targets for a beak to the downside and T1 in larger that T2 etc.
Green type are targets to the upside.
No recommendation.
Molina Healthcare, Inc. provides managed healthcare services to low-income families and individuals under the Medicaid and Medicare programs and through the state insurance marketplaces. It operates in four segments, Medicaid, Medicare, Marketplace, and Other. The company served in across 19 states. The company was founded in 1980 and is headquartered in Long Beach, California.
52 Week Range
249.78
374.00
Day Range
287.43
295.51
EPS (FWD)
20.31
PE (FWD)
14.21
Div Rate (TTM)
-
Yield (TTM)
-
Short Interest
3.62%
Market Cap
$16.83B
Volume
258,605

MOH: steady healthy trend?A price action above 296.00 supports a bullish trend direction.
Increase long exposure for a break above 306.00, which is also its 50% Fibonacci retracement level.
The target price is set at 317.00.
The stop-loss price is set at 288.00 (support trendline).
Like the higher highs and higher lows.

MOH - Short SetupLooking for a break of 272.83, would consider a potential stop of 278.53, potential first target of 230.53. Strong insider selling and Risk Reward Ratio of roughly 7.5

Earnings BeatBut price was in a rising wedge.
Seems as if earnings will often break a rising wedge whether the company beats or misses the numbers.
Both trendlines slope up in this pattern and converge at the apex.
Rising wedges cause too much supply.
There are more rising wedges well below price in this chart.
No recommendation.
W pattern that was almost to the 1.272 when this pulled back. Valley 2 is lower than valley 1 and it was looking like a Nen-Star.

MOLINA HEALTHCARE INC bullish, broke the resistance levelComment:
MOLINA HEALTHCARE INC broke the resistance 361.46 level from August 2022.
Ichimoku Trend Analysis ( AFOBAY STRATEGY):
- Kumo (Senko span A and B) up
- Kijun sen up
- Tenkan sen up
- Chiko span above candles
Next Scenario:
411.78 level is also a monthly pivot point .

Symmetrical Triangle/PC Ratio Chart to Help with Market TimingThis triangle looked as if it would break to the downside. Now price is back inside the structure but a confirmed downtrend was never established.
This is an example of why it is important to wait for a confirmed downtrend or a confirmed uptrend after the break of a pattern.
Volume declining but this is not unusual in a triangle or a flag pattern.
I do think MOH will go down eventually, but it is almost impossible to know which way this triangle will break.
I learned something new about timing market rallies versus oversold status. The market was very oversold before this bounce so it was a bit obvious it was coming.
But this put/call ratio chart is something I will also look at in the future and I did not know it was on here. This is a Put/Call ratio chart and the ratio is over the bands.
Thank you for the info markrivest (o:
No recommendation
Is Healthcare a Safe Haven?Price is still well above the .382 and also above the .236 of the long trend up.
Looking a bit toppy.
W pattern that has possibly terminated at the 1.113. Valley 2 is lower than valley 1. Looks and smells like a Bearish Shark.
(I have never smelled a shark but you know what I mean)
Be safe/No recommendation.
I have not seen much of anything in this market that looks safe right now. For some reason it does feel like some of the stocks at key levels of support post pull back or close to bottoms may have some upside, even if just temporarily.
This is too close to the top although I do like the stock.
***There are Rising Wedges well below current price.
Pennant like structure on the end of a long pole. This pattern is neutral until a trendline is broken. Watching for now.
ATH 361.25/Yearly low is 249.78/3 year low 102.85/Earnings 10-25 AMC/Short interest is less than 2%

$MOH with a Bullish outlook following its earnings #Stocks The PEAD projected a Bullish outlook for $MOH after a Negative over reaction following its earnings release placing the stock in drift C with an expected accuracy of 40%.

MOH - Expanding Wedge Expanding Wedge idea showing some bull activity above a medium dotted trend line
This expanded wedge can be accompanied by a inverted H&S pattern
This H&S pattern is yet to form its right shoulder
Bullish results?


Molina trade with trend linesToday I will trade short this stock at opening; as you can see from the chart, if there won't be a gap up at the opening bell, it's possible that the price will reach the support trend line. In case it will reach the resistance red line, I will close the position.

Double Bottom Earnings THIS AFTERNOONAnd we all know how earnings go. MOH could beat earnings and fall, miss earnings and fall, or vice versa.
Oversold on daily rsi..
MOH fell from a bearish rising wedge and is hopefully recovering. I have been watching that wedge for a while waiting on price to fall out..Rising wedges can be a long term pattern, yet a terminal one in the end. There are lots of red candles leading down to the second bottom, so selling may be close to exhausted.
Trading at earnings is risky because market response is just not something anyone can know..not a recommendation

Missed This OneI bought in and out when this was in the teens.
Three words: Managed Health-Care
Wait is that three or two?
Eh. Not thinking this ride will last indefinitely... It ain't Microsoft or Apple...
But "Right Time Right Place"
Get on board. Just stay in tune.

MOH, price moved above its 50-day Moving Average on November 02This price move could indicate a change in the trend, and may be a buy signal for investors. Tickeron A.I.dvisor found 45 similar cases, and 40 were successful. Based on this data, the odds of success are 89%. Current price $212.10 is above $193.02 the highest resistance line found by Tickeron A.I. Throughout the month of 10/01/20 - 11/02/20, the price experienced a +6% Uptrend, while the week of 10/26/20 - 11/02/20 shows a -3% Downtrend.
Bullish Trend Analysis
The Stochastic Indicator shows that the ticker has stayed in the oversold zone for 3 days. The price of this ticker is presumed to bounce back soon, since the longer the ticker stays in the oversold zone, the more promptly an upward trend is expected.
The 10-day Moving Average for MOH crossed bullishly above the 50-day moving average on October 08, 2020. This indicates that the trend has shifted higher and could be considered a buy signal. Tickeron A.I. detected that in 12 of 15 past instances when the 10-day crossed above the 50-day, the stock continued to move higher over the following month. The odds of a continued upward trend are 80%.
Following a +2.82% 3-day Advance, the price is estimated to grow further. Considering data from situations where MOH advanced for three days, in 246 of 342 cases, the price rose further within the following month. The odds of a continued upward trend are 72%.
MOH may jump back above the lower band and head toward the middle band. Traders may consider buying the stock or exploring call options.
The Aroon Indicator entered an Uptrend today. Tickeron A.I. detected that in 187 of 261 cases where MOH Aroon's Indicator entered an Uptrend, the price rose further within the following month. The odds of a continued Uptrend are 72%.
