Next report date
—
Report period
—
EPS estimate
—
Revenue estimate
—
13.5 EUR
1.07 B EUR
2.76 B EUR
74.78 M
About MSCI Inc.
Sector
Industry
CEO
Henry A. Fernandez
Website
Headquarters
New York
Founded
1998
FIGI
BBG01TNY3243
MSCI, Inc. engages in the provision of investment decision support tools including indices, portfolio risk and performance analytics and corporate governance products and services. It operates through the following segments: Index, Analytics, ESG and Climate, and All Other-Private Assets. The Index segment focuses on the investment process, including developing indexed financial products. The Analytics segment offers risk management, performance attribution and portfolio management content, applications, and services. The ESG and Climate segment includes providing data, ratings, research, and tools to help investors navigate increasing regulation, meet new client demands and better integrate ESG and climate elements into their investment processes. The All Other-Private Assets segment refers to the business intelligence products to real estate owners, managers, developers, and brokers. The company was founded by Andrew Thomas Rudd in 1998 and is headquartered in New York, NY.
Related stocks
MSCIan upward trend in the prices of an industry's stocks or the overall rise in broad market indices, characterized by high investor confidence

MSCI Inc. (MSCI) - Head & Shoulders Breakdown📉 Short Setup
🔍 Description:
MSCI Inc. (NYSE: MSCI) has formed a Head & Shoulders pattern, a bearish reversal setup. The price has broken below the neckline, confirming downside momentum. A retest of the neckline could provide another short entry opportunity.
📊 Trade Details:
🔹 Entry: B

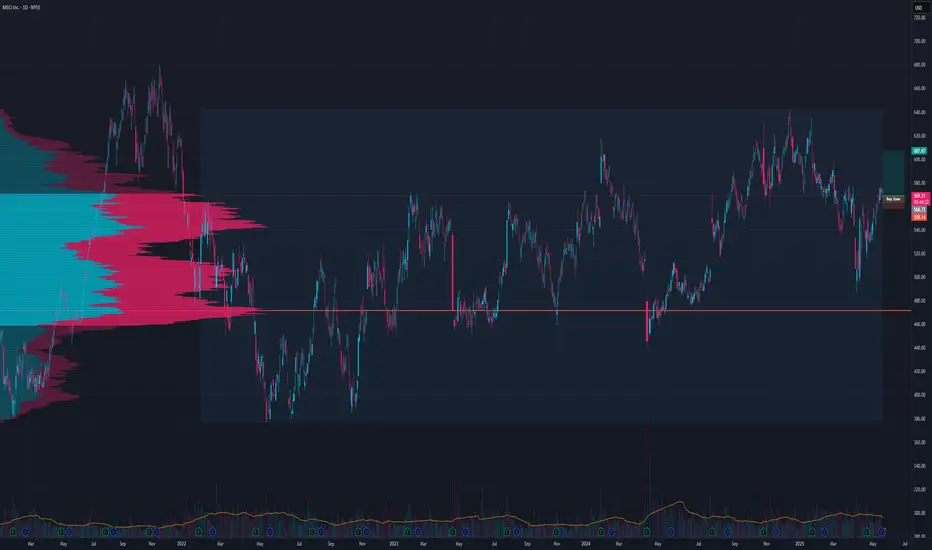
MSCI short thesisI think since the run topped in 2021, we are stuck in a sideways correction.
In my opinion, the chart did bulid out a larger wave-a to the downside in '22. Since the low, price started surging again, but im declaring these gains as a corrective move towards a lager wave-b.
Im calling out a short

MSCI - awaiting for bullish signalTime and again the market has a way to play out the traders, they knew how you draw your charts and thus the manipulators or smart money will often went below the stop loss level to take you out and days or weeks later, push the price up again.
Let's see how it goes in a week or two time.

Unlocking Profit Potential with MSCI Inc. (NYSE: MSCI)Unlocking Profit Potential with MSCI Inc. (NYSE: MSCI)
Today, I bring forth an opportunity that's been making waves in the financial world: MSCI Inc. (NYSE: MSCI). As an expert in market analysis, I strongly recommend considering due diligence in this global leader in data and software services for

MSCI Holds Earnings BreakoutMSCI rallied on strong earnings last month, and some investors may look for the gains to continue.
The first pattern on today’s chart is the bullish price gap on January 30 after profit and revenue beat estimates. The move established prices above the December 29 peak, which was the stock’s highest

MSCI.... A Sheep in Wolfe's (Waves) Clothing ???I am seeing a Wolfe Wave formation, breaking today. The target is in early March to around the $530 level. That would be an approximate 1/3 drop of MSCI's runup since late October.
Note this is a 65-minute chart view. MSCI's current beta is 1.13
Insert #1 is the last Wolfe Wave in late 2022, wit

$MSCI with a Bullish outlook following its earnings #Stocks The PEAD projected a bullish outlook for $MSCI after a positive under reaction following its earnings release placing the stock in drift A with an expected accuracy of 62.5%.

$MSCI with a Bullish outlook following its earnings #Stocks The PEAD projected a Bullish outlook for $MSCI after a Negative over reaction following its earnings release placing the stock in drift C with an expected accuracy of 55.56%.

See all ideas
Summarizing what the indicators are suggesting.
Neutral
SellBuy
Strong sellStrong buy
Strong sellSellNeutralBuyStrong buy
Neutral
SellBuy
Strong sellStrong buy
Strong sellSellNeutralBuyStrong buy
Neutral
SellBuy
Strong sellStrong buy
Strong sellSellNeutralBuyStrong buy
An aggregate view of professional's ratings.
Neutral
SellBuy
Strong sellStrong buy
Strong sellSellNeutralBuyStrong buy
Neutral
SellBuy
Strong sellStrong buy
Strong sellSellNeutralBuyStrong buy
Neutral
SellBuy
Strong sellStrong buy
Strong sellSellNeutralBuyStrong buy
USU5521TAL6
MSCI 21/33 REGSYield to maturity
5.74%
Maturity date
Aug 15, 2033
MSCI5178054
MSCI Inc. 3.625% 01-NOV-2031Yield to maturity
5.48%
Maturity date
Nov 1, 2031
MSCI4954562
MSCI Inc. 3.625% 01-SEP-2030Yield to maturity
5.33%
Maturity date
Sep 1, 2030
MSCI4989499
MSCI Inc. 3.875% 15-FEB-2031Yield to maturity
5.17%
Maturity date
Feb 15, 2031
MSCI4908223
MSCI Inc. 4.0% 15-NOV-2029Yield to maturity
4.84%
Maturity date
Nov 15, 2029
See all 1MSCI bonds
Curated watchlists where 1MSCI is featured.

Frequently Asked Questions
The current price of 1MSCI is 489.0 EUR — it has increased by 0.62% in the past 24 hours. Watch MSCI INC stock price performance more closely on the chart.
Depending on the exchange, the stock ticker may vary. For instance, on MIL exchange MSCI INC stocks are traded under the ticker 1MSCI.
1MSCI stock has fallen by −2.04% compared to the previous week, the month change is a 3.68% rise, over the last year MSCI INC has showed a 3.62% increase.
We've gathered analysts' opinions on MSCI INC future price: according to them, 1MSCI price has a max estimate of 598.94 EUR and a min estimate of 444.92 EUR. Watch 1MSCI chart and read a more detailed MSCI INC stock forecast: see what analysts think of MSCI INC and suggest that you do with its stocks.
1MSCI reached its all-time high on May 16, 2025 with the price of 515.6 EUR, and its all-time low was 471.2 EUR and was reached on Apr 29, 2025. View more price dynamics on 1MSCI chart.
See other stocks reaching their highest and lowest prices.
See other stocks reaching their highest and lowest prices.
1MSCI stock is 0.29% volatile and has beta coefficient of 0.83. Track MSCI INC stock price on the chart and check out the list of the most volatile stocks — is MSCI INC there?
Today MSCI INC has the market capitalization of 37.86 B, it has increased by 0.28% over the last week.
Yes, you can track MSCI INC financials in yearly and quarterly reports right on TradingView.
MSCI INC is going to release the next earnings report on Jul 22, 2025. Keep track of upcoming events with our Earnings Calendar.
1MSCI earnings for the last quarter are 3.70 EUR per share, whereas the estimation was 3.62 EUR resulting in a 2.02% surprise. The estimated earnings for the next quarter are 3.51 EUR per share. See more details about MSCI INC earnings.
MSCI INC revenue for the last quarter amounts to 689.40 M EUR, despite the estimated figure of 687.20 M EUR. In the next quarter, revenue is expected to reach 653.28 M EUR.
1MSCI net income for the last quarter is 266.77 M EUR, while the quarter before that showed 295.12 M EUR of net income which accounts for −9.61% change. Track more MSCI INC financial stats to get the full picture.
Yes, 1MSCI dividends are paid quarterly. The last dividend per share was 1.61 EUR. As of today, Dividend Yield (TTM)% is 1.19%. Tracking MSCI INC dividends might help you take more informed decisions.
MSCI INC dividend yield was 1.07% in 2024, and payout ratio reached 45.56%. The year before the numbers were 0.98% and 38.37% correspondingly. See high-dividend stocks and find more opportunities for your portfolio.
As of Jul 16, 2025, the company has 6.13 K employees. See our rating of the largest employees — is MSCI INC on this list?
EBITDA measures a company's operating performance, its growth signifies an improvement in the efficiency of a company. MSCI INC EBITDA is 1.65 B EUR, and current EBITDA margin is 60.98%. See more stats in MSCI INC financial statements.
Like other stocks, 1MSCI shares are traded on stock exchanges, e.g. Nasdaq, Nyse, Euronext, and the easiest way to buy them is through an online stock broker. To do this, you need to open an account and follow a broker's procedures, then start trading. You can trade MSCI INC stock right from TradingView charts — choose your broker and connect to your account.