[MicroStrategy] bearishIn the coming weeks, MicroStrategy will suffer from the trend reversal in the crypto market and the decline in Bitcoin.
1MSTR trade ideas

Microstrategy priced in Bitcoin plus holdings changesMicrostrategy priced in Bitcoin plus markers for when MSTR buys more than 1,000 Bitcoin. Also includes the one occasion MSTR sold 701 Bitcoin in red.

Riding the Bitcoin Wave: MicroStrategy's Bold Bet $MSTRIn a rapidly evolving financial landscape, MicroStrategy NASDAQ:MSTR , a business intelligence firm, embarked on a strategy that turned heads and sparked debates among investors. Mid-last year, amidst a whirlwind of fear, uncertainty, and doubt (FUD) surrounding Bitcoin's potential ETF approval and its implications, we took a position in MicroStrategy. Contrary to the narratives predicting a decline in MSTR's appeal post-ETF approval due to a presumed lack of interest, the outcome was quite the opposite. The skepticism only added a layer of amusement for us as MicroStrategy's hefty Bitcoin treasury holdings showcased an unparalleled asset accumulation strategy.
The tactic engineered by the company's founder, to leverage its stock holdings against Bitcoin, seemed almost too good to be true. Observers could be forgiven for thinking that capital was being thrown at him for free, such was the bullish sentiment among traditional investors. They've come to recognize Bitcoin not as a currency exchange medium but as a tool for capital preservation, offering unmatched security and mobility. In a domain where real estate and precious metals have long reigned supreme, Bitcoin emerged as an incontrovertible fortress of value, set to become even more scarce than gold following the next halving event, according to the stock-to-flow model.
The intrigue, however, deepens when comparing MSTR's performance to that of Bitcoin mining stocks or even Bitcoin itself. MSTR can be seen as a leverage play on Bitcoin—a simplistic view likening it to purchasing long stocks without the risk of liquidation. Such a strategy shines in a bull market, offering a straightforward path to profits. The dynamics could shift in a bear market, where the amplified leverage could work against MSTR, especially if Bitcoin experiences significant drops. A wise move for the company might involve partially selling Bitcoin profits to repurchase its stocks, mitigating potential leverage-induced risks. This approach hinges on learning from the events of 2021, as the leverage factor has since increased, and short selling has surged, fueled by affordable loans enticing speculators to chase premiums.
Our Price Targets:
Upon reviewing past targets, NASDAQ:MSTR breach of the $1,315 mark set a new precedence. What's next? The second take-profit (TP) point is pegged at $3,330, a nod to the stock's entry price in the year 2000. Despite stock splits over the years, this figure remains a significant milestone. As we navigate the conclusion of wave 3 and the onset of wave 4 in Elliott Wave Theory, our strategy remains to hold for the potential final push towards wave 5, projected between a minimum of $3,330 and a maximum of $7,000. Such targets may seem far-fetched to some, but they align with Elliott Wave and Fibonacci projections. However, given the current uncertainty in wave counts, caution is advised, reinforcing that it's better to be safe than sorry.
In summary, MicroStrategy's Bitcoin-centric strategy represents a bold and innovative foray into digital asset investment, offering a unique case study in leveraging corporate treasury for speculative gain. While the approach carries inherent risks, particularly in volatile markets, the potential rewards underscore a broader acceptance and understanding of cryptocurrency's value proposition among traditional investors. As we continue to monitor MSTR's journey, the broader implications for digital asset integration within corporate strategies remain a compelling narrative for the future of finance.
Engage with these insights by liking the post, sharing it, subscribing to our given resources, and participating in the ChartScope community! Remember, everything here is custom-made for maximum engagement and, as always, should not be taken as financial advice. Be a part of the future–track and decode volatile market dynamics with us.

MSTR longer term viewBearish divergence. Needing to retest the breakout. New high later in the year.

MSTR 76 resistance trade. Complimenting the BTC waterfall setup we also have MSTR at the local resis level.
If this is a bull trap, there's a good chance it's ending here.
Buying deep OTM puts. I hate the gap up risk. So I'll buy the cheapest puts I can. If I am right, they should all print and if I am wrong would prefer it to be cheap.
See BTC post:

Microstrategy going to $1300 ** 130%Nice explosion upcoming on Microstrategy.
$1300 by mid 2024.
Mark my words

Insider Sell-off Sends MicroStrategy (MSTR) Stock TumblingMicroStrategy Inc (NASDAQ: NASDAQ:MSTR ) recently experienced a significant downturn in its stock price, plummeting by 6% following news of insider sell-offs. Michael Saylor, the Executive Chairman and 10% Owner of MicroStrategy, sold 1,140 shares at an average price of $1,951.33 per share, totaling over $2.2 million. This sale is part of a broader trend, with insiders offloading a substantial number of shares over the past year. As investors grapple with this development, it's crucial to analyze the implications for NASDAQ:MSTR 's future prospects and investor sentiment.
Insider Sell-off and Market Reaction:
The insider sell-off, particularly by key figures like Michael Saylor, has triggered concerns among investors. The lack of insider purchases over the past year, coupled with numerous insider sells, paints a worrisome picture. On the day of the sale, NASDAQ:MSTR shares were trading at $1,951.33, contributing to a market capitalization of $28.923 billion. However, the sell-off has raised questions about the company's valuation and its long-term growth prospects.
Overvaluation Concerns and Analyst Ratings:
MicroStrategy ( NASDAQ:MSTR ) may be significantly overvalued. Analysts have voiced mixed opinions on the stock, with some maintaining buy ratings while others have lowered their target prices. The consensus among analysts underscores the uncertainty surrounding NASDAQ:MSTR 's future trajectory and underscores the importance of thorough due diligence for investors.
Institutional Investors' Stance:
Institutional investors and hedge funds have also made moves in response to recent developments. While some have increased their stakes in MicroStrategy, others have reduced their positions or remained cautious. These actions reflect the diverse perspectives within the investor community regarding the company's outlook and its ability to deliver sustained value in the highly competitive software market.
Conclusion:
The insider sell-off at MicroStrategy has undoubtedly rattled investors and cast a shadow over the company's near-term prospects. With valuation concerns, mixed analyst ratings, and varying reactions from institutional investors, navigating MSTR's stock requires careful consideration of both risks and opportunities. As the company continues to navigate the evolving landscape of enterprise analytics and mobility software, investors must remain vigilant and stay informed to make sound investment decisions.

MSTR Heading for $100Most probably with $btc price correction, its a leveraged play on BTC Price action

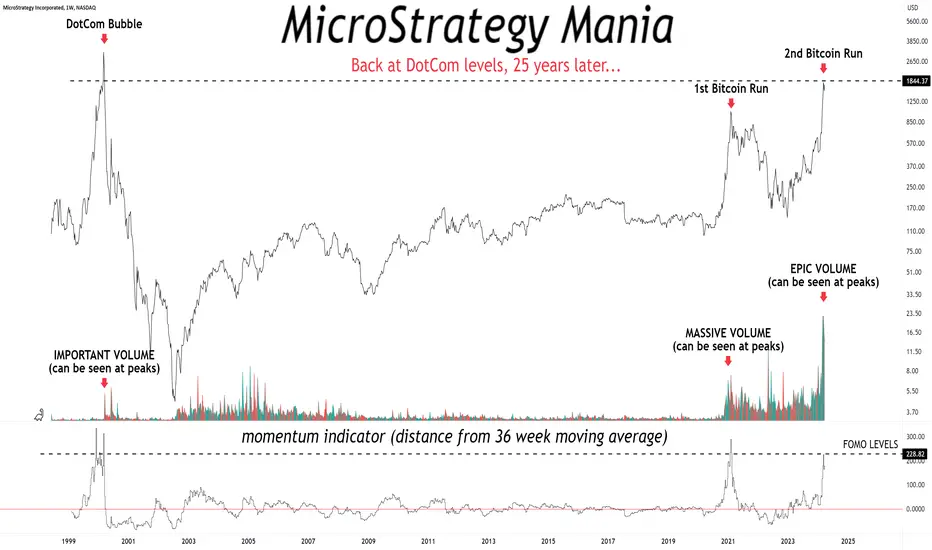
MicroStrategy ManiaMicroStrategy Mania
Low risk, high reward opportunities DO NOT look like this.
Many will get trapped.
#mstr #bitcoin #microstrategy
MSTR MicroStrategy Incorporated Fair Value | Potential Sell-OffAchieving a scenario where MSTR trades at parity with its Bitcoin reserves would necessitate a remarkable surge in BTC price to $157,000, marking a staggering 130% increase from current levels!
At today's BTC price, MSTR's ideal settlement range would hover around $775-$800, representing its fair value!
Adding a slight premium, my adjusted price target for MSTR would be $960!
The growing popularity of Bitcoin ETFs presents a challenge to MSTR's relevance, making it useless to hold MSTR at such a high premium to its BTC holdings!
It's worth noting that CEO Michael Saylor sold 1,508 shares of the company on March 14, 2024.

MicroStrategy Slumps 11% As Kerrisdale Capital Shorts The StockMicroStrategy ( NASDAQ:MSTR ) finds itself in the crosshairs of investment firm Kerrisdale Capital, as the latter takes a bearish stance on the software company's stock. Kerrisdale's decision to short-sell NASDAQ:MSTR stems from concerns over the inflated valuation driven by its heavy investment in Bitcoin. As MicroStrategy's shares plummet by 11% in response, investors are left to ponder the implications of Kerrisdale's bold move.
Kerrisdale's Short Position:
On March 28, 2024, Kerrisdale Capital publicly announced its short position on MicroStrategy ( NASDAQ:MSTR ), citing an unjustifiable premium in NASDAQ:MSTR shares compared to the spot price of Bitcoin. The firm argues that MicroStrategy's valuation, heavily influenced by its Bitcoin holdings, has soared to unsustainable levels, with the implied Bitcoin price in NASDAQ:MSTR shares surpassing $177,000.
Risky Business:
While MicroStrategy's strategic pivot towards Bitcoin initially garnered attention as a unique way to gain exposure to the cryptocurrency, Kerrisdale Capital believes that the current premium attached to NASDAQ:MSTR shares is unwarranted. With Bitcoin readily accessible through various channels, including brokerages and crypto exchanges, the rationale for paying a hefty premium for the same asset diminishes.
Market Dynamics:
Kerrisdale's short position on MicroStrategy ( NASDAQ:MSTR ) reflects a broader sentiment in the crypto stock market, where total short interest amounts to $10.7 billion. MicroStrategy ( NASDAQ:MSTR ) and Coinbase ( NASDAQ:COIN ) lead the pack, commanding 84% of the bearish bets. Despite MicroStrategy's recent surge, fueled by a 155% increase year-to-date, short sellers remain undeterred, anticipating potential market corrections.
Challenges Ahead:
MicroStrategy's bullish run has posed challenges for short sellers, with the company's outlook threatening significant paper losses for those betting against it. However, Kerrisdale's decision to short NASDAQ:MSTR underscores lingering doubts about the sustainability of its Bitcoin-centric strategy and the premium embedded in its shares.

MSTR Explained (Reverse Repo Of Bitcoin) 30k+ Target
A lot of people are critizing MSTR & Michael Saylor for his Bitcoin activity and it needs to be cleared up on how serious this is for MSTR.
If Bitcoin continues on its trajectory, MSTR will be in the top 10 companies by market cap in the SP500.
1. Spot ETF's cannot be added to SP500 Index funds.
2. Spot ETF's cannot be levered on the base price.
3. MSTR shortly will be in the SP500 index funds meaning global allocation to the standard funds will be buying up MSTR shares that MSTR in return will be using to buy Bitcoin and apply low corporate leverage debt.
SP500 Index Fund > MSTR > Debt/Bitcoin > Bitcoin scarcity increased > Spot ETF rises, increasing the MSTR total value.
Large funds can park money with MSTR that MSTR then uses extremely low corporate leverage to accumulate more Bitcoin per capital invested that they then hold and adjust shares accordingly / buy back shares.
At the end of this bull market Michael Saylor can also make a decision to get debt against a portion of his Bitcoin in the company balance sheet and use his operating income / to fund and secure the debt.
Spot ETF's are extremely important including Futures.
MSTR? also very important in what he is doing.
MSTR is not a Spot ETF it's a company with a structure to generate returns like Berkshire Hathaway, there is risk involved but Saylor has taken a route that gives MSTR a strong resilience to bear markets and stronger upside to bull markets. This might have not worked if there was too much Bitcoin supply to purchase meaning Spot ETF's out weigh MSTR.
But MSTR has more than enough for what it needs to become one of the largest investment company in the world.
MSTR on this trajectory is worth north of $20,000 per share.

MSTR has more rocket fuel LONGMSTR recently bought up a lot more coins. News that an insider sold $7 M in shares while
interesting is quite meaningless. He still has $150M plus. MSTR is riding a " Bollinger Band
march" on the upper band. This is a huge surge. I was happy to catch a buy today at $1575
off a low-ball limit order that somehow got filled. All things crypto has a great day. It was
a Magic Monday for sure. I will sell some on Thursday mid-day and buy more next Monday.
I know all the contrary ideas- Reckless abandonment. Poor risk management. The answer
my initial capital into MSTR has been long returned to the account ( then spent getting
larger in semiconductors); this is all profit being compounded. If there is some risk it is
all accepted. the entire position has a trailing stop loss of !0% - no problem seen. Risk on.
BTBT RIOT are running in the shadows and the positions are not half bad. BTUSD and ETHUSD
on forex with 100:1 leverage are carrying their own weight.

Sailing on a Rocket Ship (700s conservative)MSTR has the setup to make a move similar to Jan/Feb of 2021.
Needs to clear 658 for this to activate.
- initial target 658 by 1/3/2024
- If it breaks this next target is 781 (gap fill) by end of Jan. 2024
- If both of the above hit it will get insane from there, 1300+

MSTR: WHAT'S NEXT?Hi guys, I don't remember If I ever did an analysis on Mstr, since I have a long position I give you my view.
Could I be wrong? Obviously.
Could this pattern be the same? I don't think.
Let's see, however I'll take a profit for sure but not now.


STRC Head and Shoulders?We’ve identified a potential Head and Shoulders (H&S) pattern forming on the chart of STRC. This pattern is often seen as a reversal pattern, indicating a possible shift from an uptrend to a downtrend.


MicroStrategy Owns About 1% of Bitcoin’s Total SupplyMicroStrategy ( NASDAQ:MSTR ), under the leadership of CEO Michael Saylor, has made waves yet again in the cryptocurrency market with its latest strategic move. The company has solidified its position as a major player in the Bitcoin space by acquiring an additional 9,245 Bitcoins, bringing its total holdings to a staggering 214,246 Bitcoins. With this acquisition, MicroStrategy ( NASDAQ:MSTR ) now possesses over 1% of the entire Bitcoin market supply.
The decision to invest heavily in Bitcoin is a testament to MicroStrategy's ( NASDAQ:MSTR ) unwavering confidence in the long-term value and potential of the leading cryptocurrency. Despite recent market fluctuations, MicroStrategy has continued to double down on its Bitcoin holdings, demonstrating its commitment to diversifying its assets and hedging against fiat currency depreciation.
The funding for this significant purchase was secured through a combination of sources, including a substantial convertible debt offering totaling $592.3 million and allocation from surplus cash reserves. This bold move underscores MicroStrategy's proactive approach to capital allocation and its willingness to leverage debt to capitalize on strategic investment opportunities.
However, the announcement of MicroStrategy's latest Bitcoin acquisition was met with mixed reactions from investors. Despite the company's bullish outlook on Bitcoin, MicroStrategy's stock experienced a 13% decline following the news, coinciding with a downturn in Bitcoin's price. This reaction highlights the inherent volatility and risk associated with cryptocurrency investments, despite their potential for substantial returns.
Looking ahead, MicroStrategy ( NASDAQ:MSTR ) has outlined its plan to repay its borrowed funds in a unique manner, offering investors the option to swap cash loans for MicroStrategy shares. This innovative approach to debt repayment reflects MicroStrategy's commitment to shareholder value and its confidence in the company's long-term growth prospects.
As MicroStrategy ( NASDAQ:MSTR ) continues to navigate the evolving cryptocurrency landscape, its bold Bitcoin investments serve as a testament to its visionary leadership and strategic foresight. With its substantial Bitcoin holdings and innovative approach to capital management, MicroStrategy is poised to remain a dominant force in the digital asset space for years to come.
By seizing opportunities in the volatile yet promising world of cryptocurrencies, MicroStrategy is setting a precedent for corporate adoption of digital assets and paving the way for a new era of financial innovation and opportunity.


MSTR seems quite unpleasant!Despite Michael Saylor's MicroStrategy being one of the largest BTC holding companies, what I see on the chart doesn't make me optimistic at all about a positive correlation with a good cryptocurrency performance.
However, in the very long term, their actions may be setting up for something big.

approaching double resistLooks like a probable huge rejection incoming. Probably aligns with a top in risk on.

MSTR the time has finally comeNASDAQ:MSTR here is a Monthly chart with a start to a Bullish wedge break out , VOL MFI and MACD all in bullish flows/ momo with fundamental winds behind our sails , Looking for $1977 and $2513 and our next PT in the next 6 months
