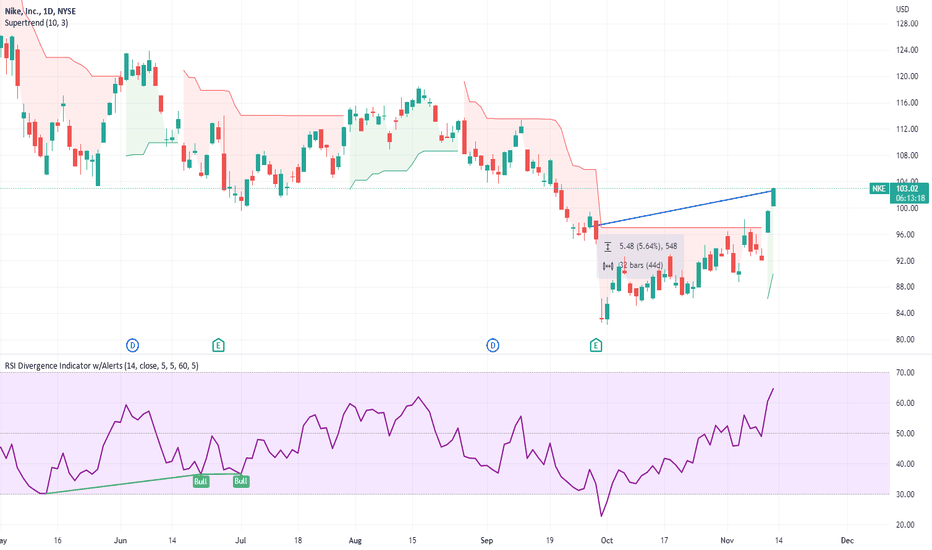
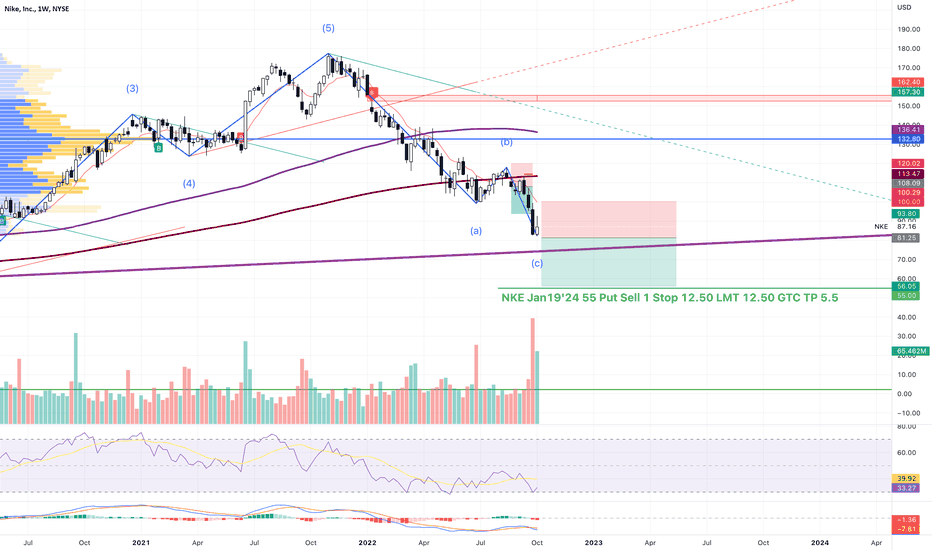
NKE SELLBearish momentum is stronger. Risk 1 to make 2. Could cut loss early since it is near 200MA on weeklyShortby CrazyBears111
Nike Running Away?Nike Short Term - We look to Sell at 136.07 (stop at 140.63) Bespoke resistance is located at 140.00. Posted a Bearish Outside candle on the Daily chart. The bias is still for lower levels and we look for any gains to be limited. The primary trend remains bearish. Daily signals are bearish. Our profit targets will be 119.93 and 111.01 Resistance: 140.00 / 155.00 / 160.00 Support: 125.00 / 120.00 / 100.00 Disclaimer – Saxo Bank Group. Please be reminded – you alone are responsible for your trading – both gains and losses. There is a very high degree of risk involved in trading. The technical analysis, like any and all indicators, strategies, columns, articles and other features accessible on/though this site (including those from Signal Centre) are for informational purposes only and should not be construed as investment advice by you. Such technical analysis are believed to be obtained from sources believed to be reliable, but not warrant their respective completeness or accuracy, or warrant any results from the use of the information. Your use of the technical analysis, as would also your use of any and all mentioned indicators, strategies, columns, articles and all other features, is entirely at your own risk and it is your sole responsibility to evaluate the accuracy, completeness and usefulness (including suitability) of the information. You should assess the risk of any trade with your financial adviser and make your own independent decision(s) regarding any tradable products which may be the subject matter of the technical analysis or any of the said indicators, strategies, columns, articles and all other features. Please also be reminded that if despite the above, any of the said technical analysis (or any of the said indicators, strategies, columns, articles and other features accessible on/through this site) is found to be advisory or a recommendation; and not merely informational in nature, the same is in any event provided with the intention of being for general circulation and availability only. As such it is not intended to and does not form part of any offer or recommendation directed at you specifically, or have any regard to the investment objectives, financial situation or needs of yourself or any other specific person. Before committing to a trade or investment therefore, please seek advice from a financial or other professional adviser regarding the suitability of the product for you and (where available) read the relevant product offer/description documents, including the risk disclosures. If you do not wish to seek such financial advice, please still exercise your mind and consider carefully whether the product is suitable for you because you alone remain responsible for your trading – both gains and losses. Shortby Saxo115
NIKE (NKE) long opportunityNKE Potential for Bullish Bounce. Good setup, Trend inversion, Inverting the Bearish trendline, now creating an ascending Bullish Channel. Disclaimer: All content has only educational and informational purposes, and never should be used or take it as financial advice.Longby Julien_Eche3
NKE LONGMarket showing bullish sign. Take 1 bullish position on defensive stock NKE.Longby CrazyBears0
Major BULLISH signal (NKE)NKE offers a good buying opportunity. The retracement seems to be complete and the stock is ready for another leg up. My goal : $136 Disclaimer: All content has only educational and informational purposes, and never should be used or take it as financial advice.Longby Julien_Eche1
NKE - Could have windNKE has been displaying strong momentum for the past few days ago, beginning with a large candle gap up on 14th Apr on strong volume. Expecting this moment to retest it's recent high @ 140 (also 38.2% fib retracement here) this week and could consolidate here a little before breaking higher eventually. Scale out along the way up and trails stops up at intervals to protect profits as market is volatile. Disclaimer: Just my 2 cents and not a trade advice. Kindly do your own due diligence and trade according to your own risk tolerance and don't forget that money management is important! Cheers. Longby Juliac0
$NKE buy the dip?$NKE been trending down for the past few months or so possibly because of the pandemic making all the shops temporarily close down all over the world.. as of for earning NKE has been good with ok projecting guidance. also there's a lot of flow calls coming in for NKE. below is my ideal entry for day trading or scalp play. $NKE average move per day is about $3.00+ a day. AAPL: Day trade or scalp target play: 04/11/22 Buy call above 135.60 sell at 137.61 or above. Buy puts below 131.11 sell at 128.78 or below. option open interest: ideal expiration date: 5/20/22 , 4/29/22 or 09/16/22 Hello everyone, welcome to this free technical analysis . ( mostly momentum play ) I am going to explain where I think this stock is going to go over the next day or week play and where I would look for trading opportunities for day trades or scalp play. If you have any questions or suggestions which stock I should analyze, please leave a comment below. If you enjoyed this analysis, I would definitely appreciate it, if you smash that LIKE button and maybe consider following my channel. Thank you for stopping by and stay tune for more. My technical analysis is not to be regarded as investment advice. but for general informational proposes onl Longby CHRIS_B58Updated 0
NIKE Trade IdeaNike has a nice divergence with the 8 and 21 ema which means if it can squeeze over resistance line of $133.46 or the 50-day ma then this thing could possibly fly into the next resistance line of $139.04. I will be watching Nike this week to see if we can make a few bucks here.Longby Dwebb2050
NIKE SHORTHere we spotted Elliot Wave. Last move to the down side before a new trend starts.by KRECHT0
$NKE Head & Shoulder PatternNike ($NKE) on the daily looks to be forming a left shoulder to complete a head and shoulders pattern. Disclaimer: Stratford Research newsletters reflect the research and opinions of only the authors who are associated persons of Stratford Consulting Ltd. The newsletters are for informational purposes only and are not a recommendation of an investment strategy or recommendation to buy or sell any security or digital asset (cryptocurrency, etc.) in any account. The information provided within the newsletters is not intended to serve as the basis for any investment decision. Any third-party information provided therein does not reflect the views of Stratford Consulting Ltd. or any of its subsidiaries or affiliates. All investments involve risk including the loss of principal and past performance does not guarantee future results.Shortby atrusik0
NKE go longPossible long here at the bottom of the flat weekly channel, I'd scale in a bit every week.Longby ali925M0
NIKE: Reversal Head & ShouldersDaily Mayor Pattern: Reversal Head & Shoulders Trigger point Buy 140 Failure Sell point 131.20by dan686080
Nike ..... Is a BuyI'm looking for a nice recovery in Nike. Not new highs but a nice return none the less. There is a price gap as noted. Likely that is filled IMO.Longby oliverrathbun1
$NKE with a Bullish outlook following its earnings #Stocks The PEAD projected a Bullish outlook for $NKE after a Positive over reaction following its earnings release placing the stock in drift B with an expected accuracy of 62.5%.Longby EPSMomentum1
Nike (NYSE: $NKE) Running On Earning's Beat! 👟NIKE, Inc., together with its subsidiaries, designs, develops, markets, and sells athletic footwear, apparel, equipment, and accessories worldwide. The company offers NIKE brand products in six categories, including running, NIKE basketball, the Jordan brand, football, training, and sportswear. It also markets products designed for kids, as well as for other athletic and recreational uses, such as American football, baseball, cricket, golf, lacrosse, skateboarding, tennis, volleyball, walking, wrestling, and other outdoor activities; and apparel with licensed college and professional team, and league logos, as well as sells sports apparel. In addition, the company sells a line of performance equipment and accessories comprising bags, socks, sport balls, eyewear, timepieces, digital devices, bats, gloves, protective equipment, and other equipment for sports activities; and various plastic products to other manufacturers. Further, it provides athletic and casual footwear, apparel, and accessories under the Jumpman trademark; and casual sneakers, apparel, and accessories under the Converse, Chuck Taylor, All Star, One Star, Star Chevron, and Jack Purcell trademarks. Additionally, the company licenses agreements that permit unaffiliated parties to manufacture and sell apparel, digital devices, and applications and other equipment for sports activities under NIKE-owned trademarks. It sells its products to footwear stores; sporting goods stores; athletic specialty stores; department stores; skate, tennis, and golf shops; and other retail accounts through NIKE-owned retail stores, digital platforms, independent distributors, licensees, and sales representatives. The company was formerly known as Blue Ribbon Sports, Inc. and changed its name to NIKE, Inc. in 1971. NIKE, Inc. was founded in 1964 and is headquartered in Beaverton, Oregon.Longby Bullishcharts2211
Earnings watch 3/21Earnings watch 3/21 NKE PDD TME VLTA DRIO KERN FAT AUGX BWMN TELA Do your own due diligence, your risk is 100% your responsibility. This is for educational and entertainment purposes only. You win some or you learn some. Consider being charitable with some of your profit to help humankind. Good luck and happy trading friends... *3x lucky 7s of trading* 7pt Trading compass: Price action, entry/exit Volume average/direction Trend, patterns, momentum Newsworthy current events Revenue Earnings Balance sheet 7 Common mistakes: +5% portfolio trades, capital risk management Beware of analyst's motives Emotions & Opinions FOMO : bad timing, the market is ruthless, be shrewd Lack of planning & discipline Forgetting restraint Obdurate repetitive errors, no adaptation 7 Important tools: Trading View app!, Brokerage UI Accurate indicators & settings Wide screen monitor/s Trading log (pencil & graph paper) Big, organized desk Reading books, playing chess Sorted watch-list Checkout my indicators: Fibonacci VIP - volume Fibonacci MA7 - price pi RSI - trend momentum TTC - trend channel AlertiT - notification tickerTracker - MFI Oscillator www.tradingview.comby Options360Updated 1
Nike. Its just doint it. NKEImmediate targets 154, 159, 163. We are not in the business of getting every prediction right, no one ever does and that is not the aim of the game. The Fibonacci targets are highlighted in purple with invalidation in red. Fibonacci goals, it is prudent to suggest, are nothing more than mere fractally evident and therefore statistically likely levels that the market will go to. Having said that, the market will always do what it wants and always has a mind of its own. Therefore, none of this is financial advice, so do your own research and rely only on your own analysis. Trading is a true one man sport. Good luck out there and stay safeLongby Rykin_CapitalUpdated 4
Earnings 3-21 AMC SharkEarnings on Monday after market closes. A lot depends on the response to the earnings and guidance and is risky to trade close to earnings. Possible stop below 116.74 or where you see support. Price is at a resistance level today. Marubozu today candle which is bullish. Both the top and bottom of today's candle are shaven. Price hit resistance for now at top of prior big red candle. Peak 1 is lower than peak 2. The Bullish Shark pulls to the .886 or the 1.113 on the final leg. NKE over shot the 1.113 by a few dollars. Sometimes a harmonic pattern does not hit right on the dot but if it is not in the ball park, the pattern is not valid. I teach yoga so I am flexible (o; Any pattern can fail. The bottom of an old gap kicked in as support. Short percent is 0.85%. The longer term moving averages need some work with negative crossovers noted. Moving averages are lagging indicators. The Alligator is trying to turn up and this indicator is comprised of short term moving averages/5, 8, and the 13. I have the 5 in red and ideally this moving average should be on top of the 8/white and the 13/blue. . No recommendation. If you are bearish or bullish long enough, you will eventually be right. (o:by lauralea0
Nike Shorts - $12050 MA crossing under 200 MA = Death Cross. Price has left the upsloping pitchfork, and has begun travelling down the down-sloping fork. MACD about to cross bearish. On the hourly, Head & Shoulders has formed right under the down-sloping fork's median line. Downside Target - $120 - Which coincides with 0.618 fib fan & 0.5 Fib retrace level towards the end of March. Shortby Cousin_Fat_FatUpdated 2
NIKE ABC CORRECTIONMarket just finished 1-5 Elliot wave and started going down, we are waiting for it to bounce off of a 50% fib zone, retrace to a trend and go down to our demand zone, where we should enter the market for a long position and expect retrace to 50% fib zone of downwards movement. AROON: Shows gain in a bearish momentum so it means we should hit our 50% fib zone Supply/demand zone: Shows strong demand zone at 79$ zone where we should get our entry entry: 79 invalidation: 48 (I will not be putting invalidation on my trade because Nike is on of the industry's giants and we should see rise in price in a long term.) target: 118 Longby vf_investment114
NIKE SHORTMarkets are in bearish mode we have more room to downside we can open $NKE short.Shortby zagass20
NKE | GuidanceJournal Entry Bias: Negative. Sentiment: Pessimistic. Emoji (emotion): Bored 😑. Null Hypothesis: Sell. Alternative Hypothesis: Buy. Signals: ... Position: Short term day trade. Notes: ... Barron's Company Overview: www.barrons.com . Other: ... Tutorial: (Q/A) What exactly is the box labeled tolerance? The box labeled tolerance is a defined range of value & time that qualifies the right to exit the trade after a profit is made; as long as the security is inside the box and above the trade's entry one could say the profit is within tolerance, likewise if the security is outside the box either because of value or time one could say the profit is not within tolerance. It's a way to add parameters to the future outcome (as a means to grade the journal entry) while simultaneously providing leniency in the ability to achieve success with said journal entry. Social: I'm happy to hear from my readers/audience and I encourage constructive feedback; although I'm busy I will give my best effort to reply. About the Author: I'm not a Wall Street retailer or promoter I don't have products/services for sale and my intentions aren't geared towards pumping securities, although I am a financial scientist and one of my sources of income is trading; that is to say anything offered to the community is apart of my scientific journal or goodwill to mankind (you're very welcome). I also strive to become one of Tradingview's pinescript Wizards and Top Authors, as well as build a reputable reputation & following. About the Security: "NIKE, Inc. engages in the design, development, marketing, and sale of athletic footwear, apparel, accessories, equipment, and services. It operates through the following segments: North America, Europe, Middle East & Africa, Greater China, Asia Pacific & Latin America, Global Brand Divisions, Converse, and Corporate. The North America, Europe, Middle East & Africa, Greater China, and Asia Pacific & Latin America segments refer to the design, development, marketing, and selling of athletic footwear, apparel, and equipment. The Global Brand Divisions represent its NIKE Brand licensing businesses. The Converse segment designs, markets, licenses, and sells casual sneakers, apparel, and accessories. The Corporate segment consists of unallocated general and administrative expenses. The company was founded by William Jay Bowerman and Philip H. Knight on January 25, 1964, and is headquartered in Beaverton, OR." Disclaimer: My journal entry is not a complete prospectus, please consider it accordingly.Shortby UnknownUnicorn287435972
Looking down the road for a NKE reversalI hate talking about water under the bridge, but this time I will bring up the case of NKE. What I am disgruntled about is that I I didn't head my own (documented) thoughts on NKE that I had posted on Jan 19: Depending on how you look at it, there has been 4 times that puts below 144 would have worked out wonderfully. The time, I thought I push to 135 would hold as support but that has proved wrong. I hate to chase so I am looking forward to a reversal. I do want to point out a possible future long.... **__Price History: __** **YTD** -24% **1 Month** -14% **3 Month** -26% **6 Month** -23.5% **1 Year** -7% **5 Year** +121% +01% off 52 week low -30% off 52 week high Recently a gap was filled - previously created in June 21' and fully filled Feb 21' Dividends are here! Historically over the past year NKE has seen a sell off proceeding ex-dividend periods. I won't speak too much on this outside this isolated observation - MM hedging around this period can make the options chain hard to read. Ex-Div. Date Amount Type Yield Change Rec. Date Pay. Date 3/4/2022 $0.305 Quarter 0.9% N/A 3/7/2022 4/1/2022 **__Indicators__** - 3 Day Chart **Moving Averages** Easily summed up as trading below all MA's, the 12/26 EMA, 50/200 SMA, and 9 HMA The most import to note is the break of the current 3 Day candle below the 200 SMA. A failure to recapture the 200 SMA by the close of this candle could set up NKE for further selling pressure before earnings. **RSI** Showing signs of being oversold on its current candle and has been hovering right above oversold for over 30 days now - no divergence present currently **SO** Shows oversold conditions since early Jan 21' and the break below its 50 SMA. The SO remained relatively the same since. **QQE** Shows momentum to the downside. When compared to the ATR and RSI, the QQE makes sense in this case. There are very little signs of a momentum shift that is imminent. **ATR** Specifically the decomposed ATR we see that the stock (recently) has had increasingly bearish range with decreasing bullish range - there is no divergence apparent (yet). 1 year ago NKE was trading at SIMILIAR price levels with about less $2 of bearish price movement as compared to today. The important thing to note here is that there seems to be compounded bearish pressure present causing additional volatility on red days. **OBV** Tracking price closely with no signs of major divergence, although the OBV is declining telling us that volume on down days is getting stronger - thus influencing the ATR (IMO) **__Thoughts on Price Momentum and Direction__** **Candles** The 1 month chart shows a current candle that has opened below and trading below the open of the June 2021 monthly candle - I would look for 122.44 to act as support if bearish momentum continues. This is a level that a reversal could be looked for. Any CLOSE of the March monthly candle below 122 would make me feel like the selling pressure would continue. The 50 MA on the monthly chart could also be used as a level of (possible) support. $122(+- The 3 day chart shows a current candle with 1 more trading day left - Bulls would want this to close above 128 ( Local Support from 1 year ago) and bears would obviously want to close the candle below - again, closing below $122 would indicate continued selling pressure. Since the gap is filled, the biggest highlight here is holding support (122) or not. **Earnings** Historically, NKE has had a beat on earnings for the past 6 reporting periods. EPS reporting turned $0.90, $0.93, $1.16, $0.83 were reported period ending Feb 21, May 21', Aug 21', and Nov 21' respectively. Although the Nov 21' earnings beat, it was down from Aug 21. Estimates now show $0.72, a slightly higher bar than Novembers' expectations but down from what was reported. This to me just says that analysts are expecting the effects of COVID, the labor market, and overall transportation costs to weigh heavily on NKE's earnings. It is also important to note that no dilution has occurred in the last year. **Insiders** According to **__Fintel: __** Shares Outstanding 1,581,295,273 shares Insider Shares 251,328,587 shares Insider Ownership 15.89% Total Insiders 48 "**Insider Accumulation Score** According to Fintel: "The Insider Accumulation Score is the result of a sophisticated, multi-factor quantitative model that identifies companies with the highest levels of insider accumulation. The scoring model uses a combination of the the net number of insiders buying the prior 90 days, the total shares bought as a percentage of float, and the total shares owned by insiders. The number ranges from 0 to 100, with higher numbers indicating a higher level of accumulation to its peers, and 50 being the average." Score: 8.88 (12942 of 13931) - as reference the top rated ticker REFI has a score of 99%+ Although higher insider ownership typically signals more confidence in a company's outlook and ownership in its shares. The more insiders that hold shares the more they would be (in theory) incentivized to do good for the company and help increase its profitability and shareholder value. **Net Number of Insiders Buying (Rank)** -3 (3.38%) 13784 out of 14266 Net Number of Insiders Buying is the total number of insiders buying minus the total number of insiders selling in the last 90 days. The percentile rank is shown here (range from 0 to 100%). **Options** TOTAL OI -527K Call 272K Put 255K P/C RATIO - 0.94 Most significant chain activity on 3/7/22 : The 3/25/2022 strike P $135.00 had a previous day volume of 930, OI of 1,583 and a current OI of 2,243 for a overall charge of +660 (+41.69%) The 3/18/2022 strike P $125.00 had a previous day volume of 1,376, OI of 3,655, and a current OI of 4,309 for an overall change of +654 (+17.89%) Top 10 chains by OI **Chain Bid-Ask Low-High Vol OI** 3/18/2022 C $160.00 $0.00-$0.03 $0.02-$0.06 24 23,946 3/18/2022 P $160.00 $35.25-$35.90 $34.90-$35.70 25 18,805 1/20/2023 C $180.00 $2.35-$2.73 $2.40-$3.25 108 11,596 3/18/2022 C $150.00 $0.03-$0.04 $0.03-$0.15 1,220 11,313 1/20/2023 C $165.00 $4.10-$4.40 $4.10-$5.00 17 11,107 3/18/2022 C $140.00 $0.14-$0.21 $0.19-$0.72 267 10,462 6/17/2022 C $125.00 $10.00-$10.40 $9.85-$10.40 217 10,433 3/18/2022 P $140.00 $15.40-$15.90 $9.60-$16.02 123 10,040 3/18/2022 C $155.00 $0.01-$0.02 $0.02-$0.08 58 8,876 3/18/2022 P $150.00 $25.00-$25.95 $21.07-$25.30 22 7,218 What is important to note here is the $160 Puts and Calls holding the highest OI - premium heavily favoring the Put side. **__Further Observations__** I see NKE continuing its downward trend to test 122. This is a critical level that could start to form support in order for a reversal. An official reversal to me would come with a 3Day candle closing opening above 122 and a close above 135-137. On the monthly, to be more conservative, confirmation would come with a candle close above $150. The QQE on the monthly chart has just flipped (negative) showing (again) bearish momentum - this I do not like if I were to look for a long position too close to the (assumed) $122 support level. I do think, with the right patience, a comfortable long could be taken at confirmation of reversal (early at 135, late at 150) to test ATH's again (179.10). This could equate to a 20-30% gain in full - this is what I will be targeting. **__NFA Disclaimer__** This is NOT FINANCIAL ADVISE. These are my own unique opinions based on MY observations and MY experience. I only wish to document and share my thoughts on NKE. DO NOT take this is as a buy or sell signal, you must manage and take responsibility for 100% of your own trades. Longby OccamsPhazer115