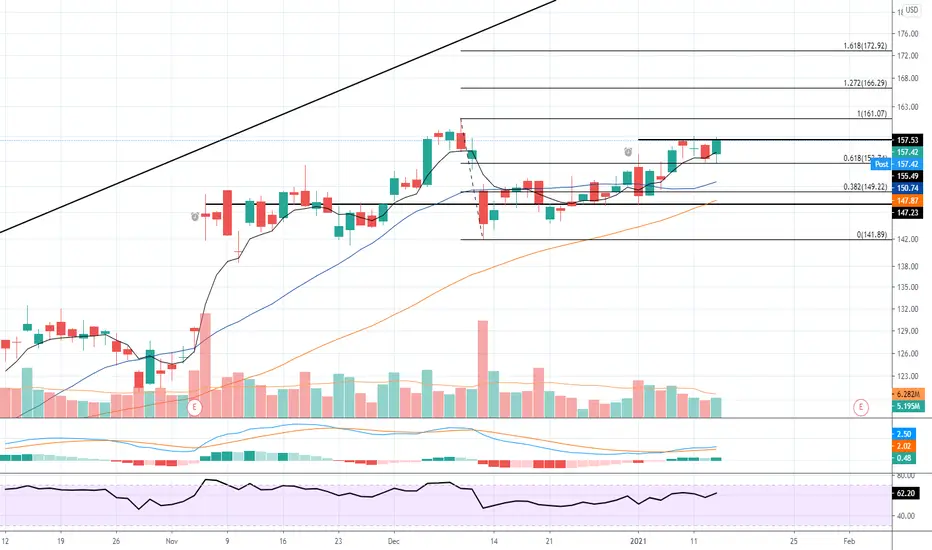
ULTIMATE STOCK INDICATOR combined with PITCH FORK $QCOMBUY SIGNAL flashed with 7 confirmations (not 8, which is max)
- staying within upward trend.
- pithfork brings the price at lower end and holding support.
- earnings runup should bring it past ATH.
- keep your stop-loss narrow since any negative market will break down trend.
Happy Trading, from CJ -- aka the greatest FURU.
To find out more about The Ultimate Stock Indicator on Tradingview, please check my public profile.
1QCOM trade ideas

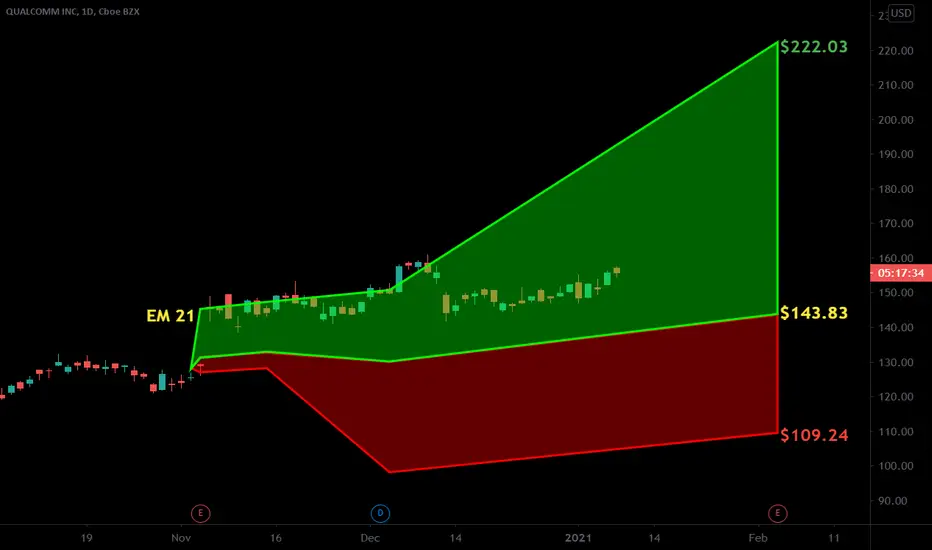
Channel tradeQualcomm just bought out Nuvia and they must've got me cheap cause they are roaring premarket.. Qcom has been trading at the lower end 9f the channel since apple announce they would be ditching Qcom chips in the near future. This buy out of Nuvia might just get it back over that divider.
Targets/green lines
156.54
161.04

QCOM BullishJust getting my idea out here - QCOM looks like it is picking up some steam and could be a good bullish pick. Based off of price action and technical indicators. Tradingview rates QCOM as a buy.


$QCOM following through its PEAD projection $QCOM followed through the PEAD projection trading within the PEAD cone which was predicted after a positive over reaction following its earning release trading mainly within the upper region of the PEAD cone.
If you would like to see the Drift for another stock please message us. Also click on the Like Button if this was useful and follow us or join us.

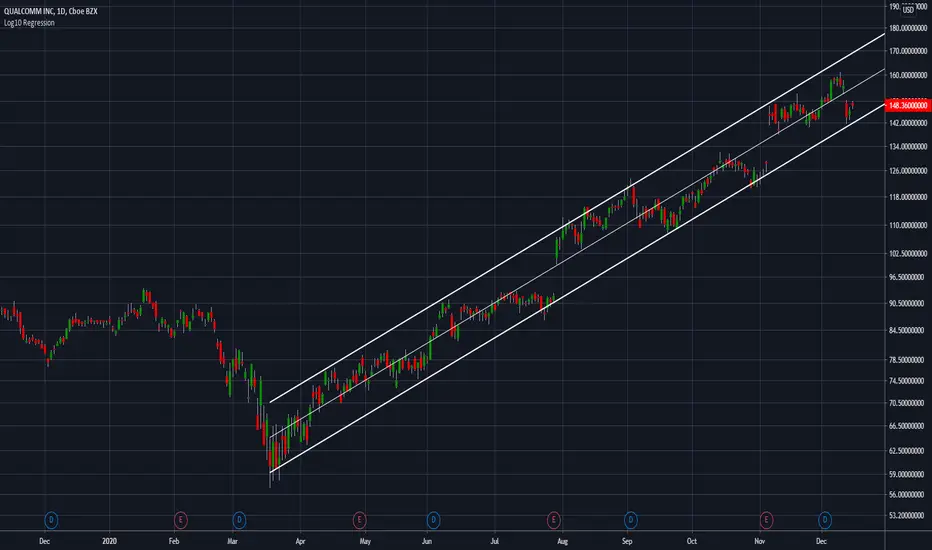
QCOM - January 2, 2021QCOM engages in the development and licensing of of wireless products, network equipment, and broadband gateway equipment. QCOM receives approximately 23% of their revenues from patents they own. This contributes to a higher gross margins (58%) and reoccurring revenues. QCOM currently trades at a forward revenue of 7.5x and forward EBITDA of 22.8x. They are set to benefit greatly from the rollout of 5G as telecom providers have been investing heavily into new infrastructure. QCOM is holding the lower limit of this channel, and has the opportunity to push nicely higher to all time highs at 160.
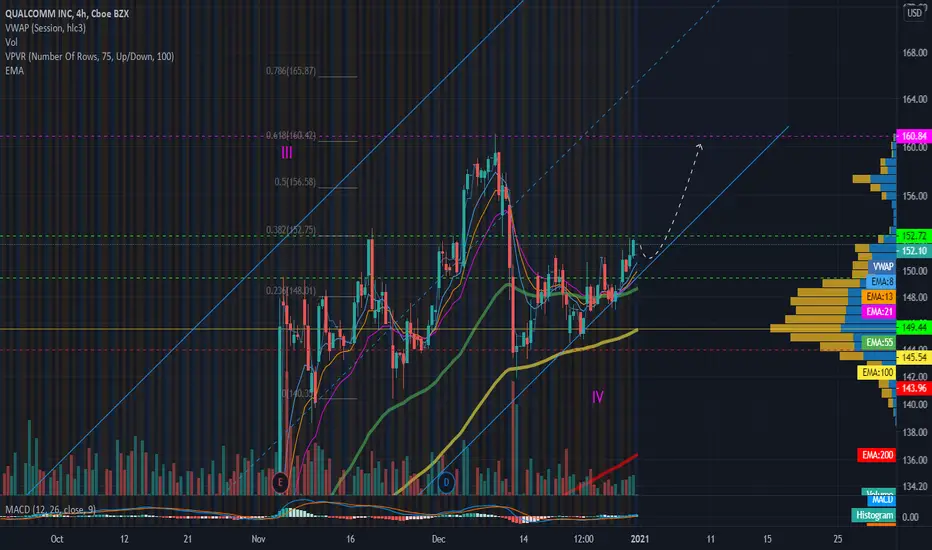
QCOM swing trade ideaQCOM swing trade idea
QCOM broke an ascending triangle to pick up some
momemtum.
Clear MACD crossover on the 4H and will bring MACD
confirmation on the daily.
RSI is looking very strong on both timeframe giving previous
momentum confirmation.
Price is above the 10MA for both.
Weekly support at 144.82
PT : 153.75 / 156.98 / 161

QCOM12/27/20 - 1d Time Frame
1. Price action seems to be consolidating at the 151-141 area
2. MACD - lines seems to be converging and histogram seems to show downtrend losing momentum
3. Stochastics at oversold level at the 1day time frame - bullish
**We could see a bullish run once price goes over the 8/21 ema and MACD starts to kiss and point upwards.
Disclaimer:
My post in this channel should not be used as a replacement for investment advice from a qualified professional. All my post is for my own chart analysis practice, informational and entrainment purposes only as I am not a registered investment advisor and do not offer investment advice. You, the reader, bear responsibility for your own investment and trade decisions and should seek the advice of a qualified securities professional before making any investment or trade.

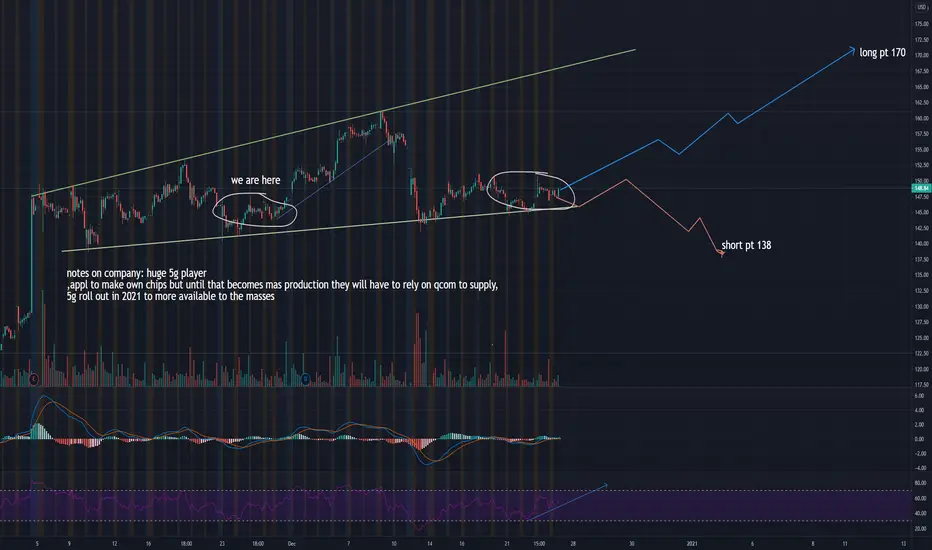
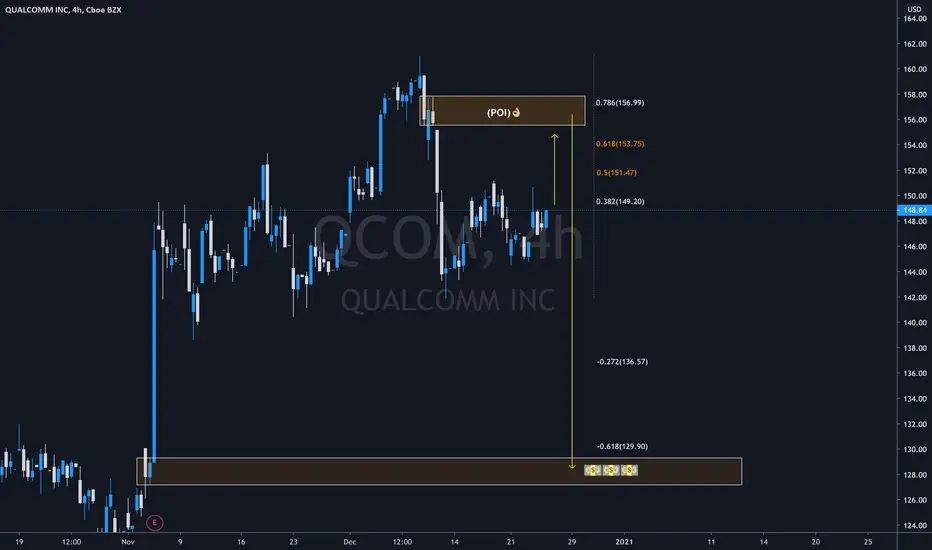
$QCOM Qualcomm INCI'm really digging this setup. Longterm i am bearsih but for the short term i am bullish until it reaches the (POI) and then, we wait and see if the price breaks above the (POI) or shows a pull back. IF it breaks above leave your positions open and if it breaks below take your profits and open a short position and the TP will be 💵💵💵. As simple as that.
I came to this conclusion after a multiple timeframe analysis but these scenarios can change anytime so keep an eye. So far it looks fat and juicy.
I can't stress enough, always use a stoploss.
Trade Safe.
Like if you like my analysis.
Thanks.
Elliot wave analysis for QUALCOMM INC- BULL CASEPossible entry points when 50 EMA crossed by price.
-------------------------------
THIS IS NOT A FINANCIAL ADVICE

Head and Shoulders QCOMPotential head and shoulders sighting in QCOM. We should wait for the breakout to happen at the neckline after which a corrective wave will follow. I expect the correction to be at ~$85 which is about 40% short trade. Do you agree with the idea?

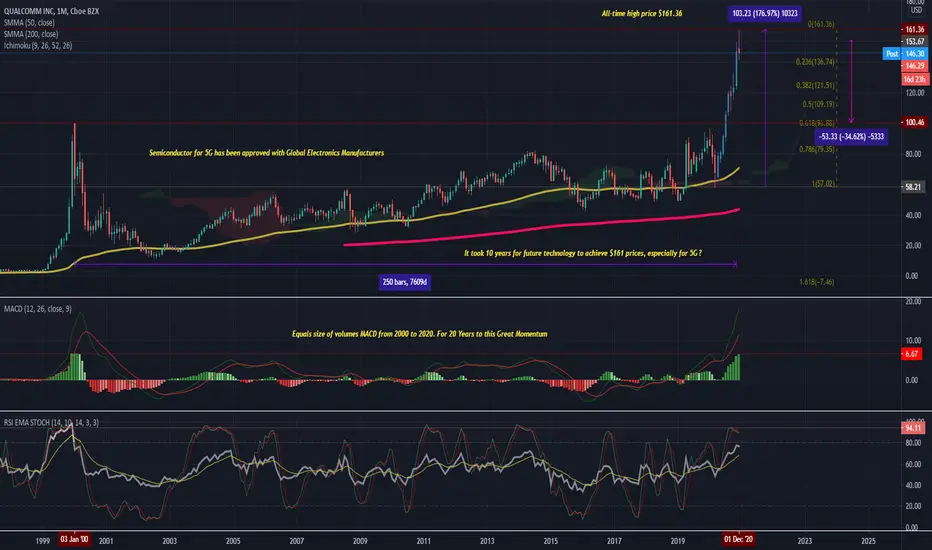
Forecasting Plan Qualcomm Wednesday, 23 December 2020
8:32 AM (WIB)
Technology and Artificial Intelligence with 5G will be a more powerful dynamic in every aspect of life with Qualcomm.
investor.qualcomm.com
Best regards,
RyodaBrainless
"Live to Ride and Ride to Live"

QCOM potential C wave beginning, target 135The cyan count is the alternate bullish possibility.
Copyright Rohan Karunaratne 2020

QCOM Trade IdeaSetting up nicely, selling pressure does not seem like it's exhausted yet though. Watching levels.

Possible Elliott Wave in QCOMI'm no expert, but I think it is possible that QCOM will have a correction to ~110. We should see ~45% short in the next 6 months or so. Any thoughts?

$QCOM 2020-DEC-16𝙌𝘾𝙊𝙈 𝘿𝙄𝙑𝙄 𝙃𝙄𝙏𝙎 𝙏𝙃𝙀 𝙍𝙀𝙎𝙀𝙏 𝙎𝙒𝙄𝙏𝘾𝙃.
The RSI has reset back to it's historic rally point; and the price is just above the lower bound of the rising channel. This has been surprisingly steady since March.

QualcommTuesday, 15 December 2020
5:23 AM (WIB)
Billions, maybe trillions of times a day…
That’s how often people around the world touch something made better by Qualcomm. It could be the smartphone in your pocket, the tablet on your coffee table, that wireless modem in your briefcase… it could even be that navigation system in your car or that action camera strapped to your chest. Who is Qualcomm, and what do we do? We are engineers, scientists, and business strategists. We are from many different countries and speak many different languages. We come from diverse cultures and have unique perspectives. Together, we focus on a single goal—we invent breakthrough technologies that transform how the world connects, computes, and communicates.
We often do what many thoughts were impossible.
Related Links:
www.qualcomm.com
www.youtube.com
Best regards,
RyodaBrainless
"Live to Ride and Ride to Live"
QCOM - Gap Fill?Looks like we should fill the previous gap up. Maybe we will crash through EMA for quick win. Probably thought things will recover slightly and be flat. Sold -4 QCOM 1/15/21 155/165c for 1.45
