great chart request!QCOM why did i sell my shares at 105 avg, argh i did the same with SQ 100 avg. i need to work on my diamond hands. Id put a 200 pt on QCOM but it could take 2-3 months. be careful adding calls. IMO we are at the top of this trend for now, and looking for a dip add at 130-135, ill alert my entry like always ! gl :)
1QCOM trade ideas

QCOMInto all the good stuff
TRANSPORTATION TECHNOLOGY
FABLESS SEMICONDUCTOR COMPANIES TELECOMMUNICATIONS EQUIPMENT VIDEOTELEPHONY SOFTWARE APPLICATIONS MOBILE TELECOMMUNICATIONS SYSTEM SOFTWARE FLEET MANAGEMENT GSM NETWORK ACCESS VOICE AND DATA COMMUNICATIONS WIRELESS PRODUCTS QUALCOMM WIRELESS INDUSTRY APPLICATION PROCESSING CDMA

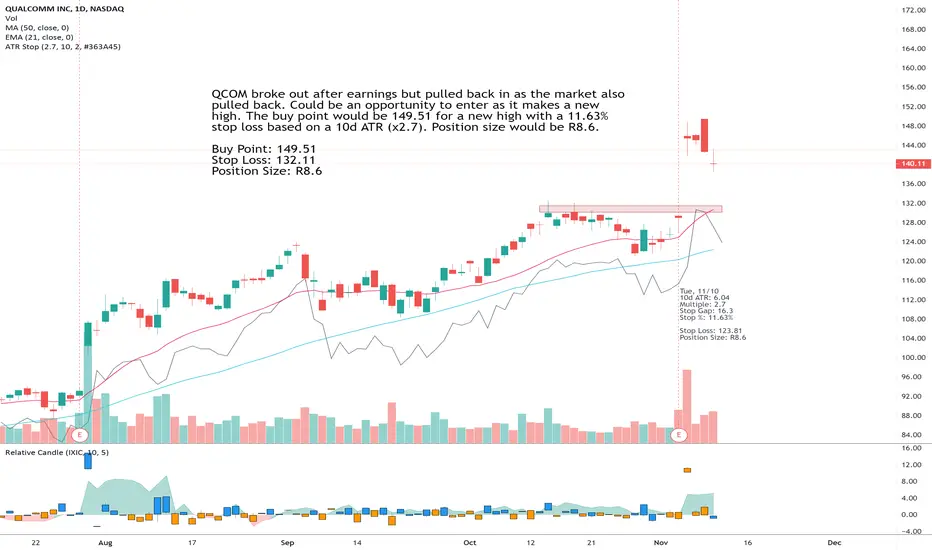
QCOM pull back offers another entry pointQCOM broke out after earnings but pulled back in as the market also pulled back. Could be an opportunity to enter as it makes a new high. The buy point would be 149.51 for a new high with a 11.63% stop loss based on a 10d ATR (x2.7). Position size would be R8.6.
Buy Point: 149.51
Stop Loss: 132.11
Position Size: R8.6
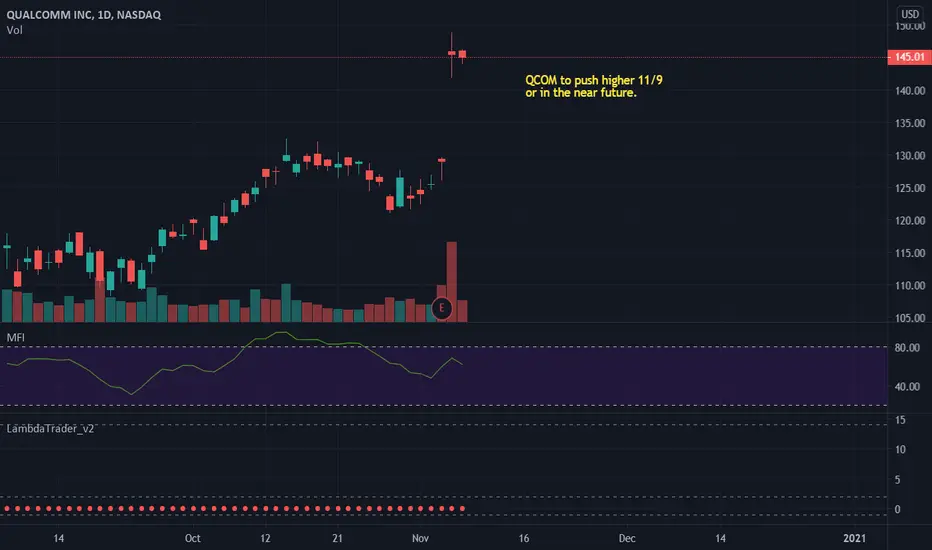
QCOM MooningVolume and price action give the sense that the sell off after the large gap up is coming to an end. Look for price to push higher.
$QCOM Qualcomm Bet on 5G into Earnings.
Expectations high for QCOm coming into earning's and the
reaction to SWKS earnings may be concerning.
Will evaluate the situation as the day progresses and election
outcome will sway taking a entry.
Possible Bull-Flag breakout today
Fibonacci Targets $133 -$139

$QCOM Qualcomm On Watchlist for trendline breakMay be possible we get a runup into earnings for QCOM. Stock has held quite strong in the past few weeks whereas others have suffered much stepper declines.

Narrow Pivot Range QCOMNarrow Pivot range for November heading into Earnings on 11/4. Suggests a large move. Lets see if bulls absorb here at the pivot range for higher prices.


QCOM w43 2020. Risky long to 132$. Better w8 correction to 100$Whole Picture
Price in upward channel
Weekly
Uptrend reach its high.
Now its time to loose steam and get corrected for price.
If it is not good earning on Q3 it is better sell. and open from 112 - 118.
Price is on the top of channel. too risky to buy.
Case 1.
Positive Earnings and good political sitatuion = Long up to 143$
Open Now
TP 132$
SL 115$
Case 2 - more possible.
Weak earings in Q3. - deep correction to 100$
For now i think the best way is to work in short terms.

daily analysis of QUALCOMM INC Hi friends
my recommendation for this market is to go buy because the daily graphical analysis shows that it will experience an uptrend in the coming days with a high probability

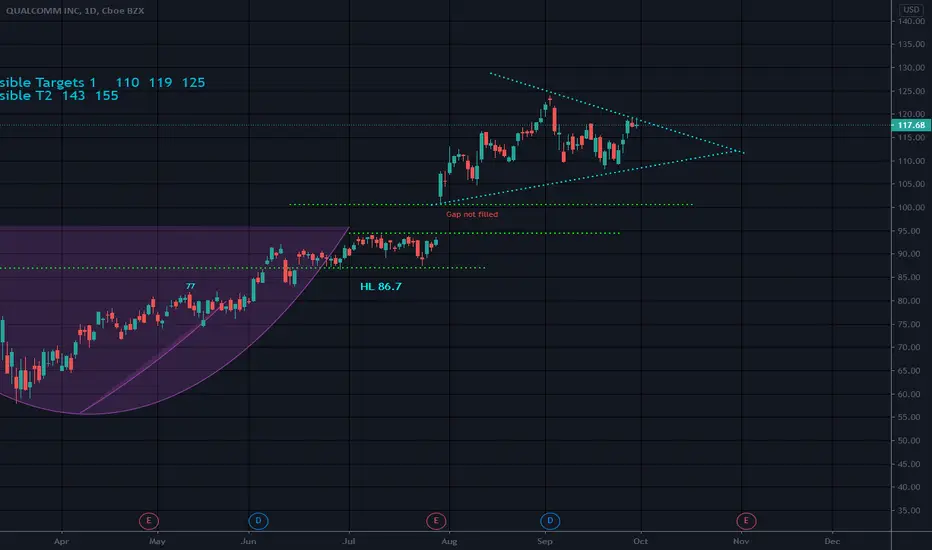
Long Position with break triangle patterGood day!
I see the clear triangle patter on 1w chart, now the price covered 2/3 of pattern and probably ready to test support and resistance.
After falling of SMP I expect accumulation of Momentum and power to make trend go up.
On RSI and chart we have slight Divergence, but i suppose its related to SMP falling and reflex it.


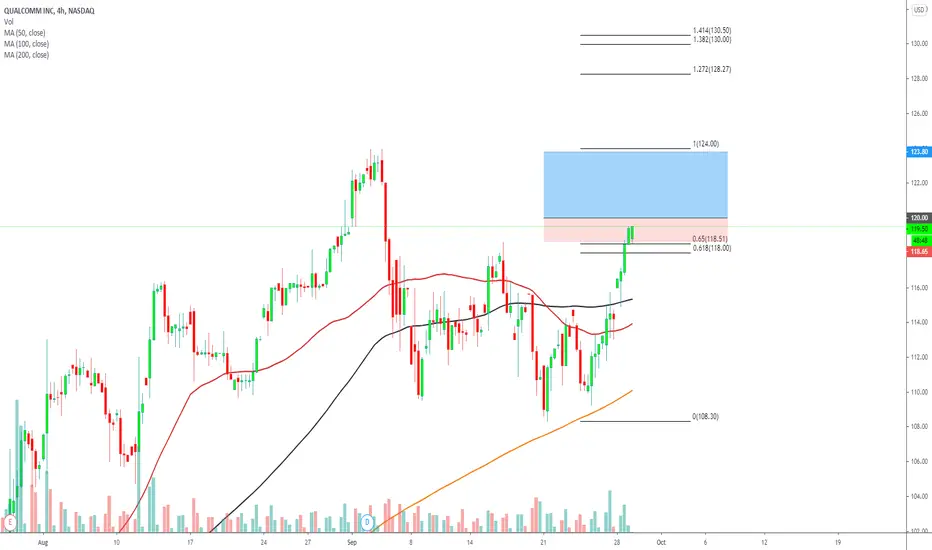
QCOM prepare to short, When back into Supply ZonePrice breakout, and Short when it comes back to Supply Zone
Supply Zone breakout -- not sure it is true or false
Short when it comes back to Supply Zone
RSI Divergence
Stop order to Short: 124
Stop 127
Target 116; reward:risk=3:1
Target 109; reward:risk=5:1
I am not a PRO trader. I need few months to practice trading strategies.
If you like this idea, please use SIM/Demo account to try it, until my trading plans get high winning rate.


QCOM 4 hr symmetrical triangle breakout scenarios NASDAQ:QCOM Recently exploded above 100, fueled by the hype of 5G. looking at the 4 hr chart, we have a strong symmetrical triangle pattern formed with breakout potential to both the bull and bear side. QCOM appears to have only slowed down due to the recent sizable pullback to QQQ and the tech sector as a whole. I am feeling very bullish on QCOM and will be looking to scalp on breakouts of the 120.2 supply and the ATH. If tech continues to bleed, we could see a solid short opportunity on a break below the trend line support, using the demand zones as TP points.

Cup and HandleLong when chart chills out a bit
Chart is in a bit of a struggle right now it appears. There is an unfilled gap below price that will provide excellent support.
I sold half of my position and waiting until the struggle resolve to buy more..I really do not like gaps underneath mel. The closer I can get on entry to that gap, the better
Possible rising wedge with bottom trend line of the RW at 111.6ish
QCOM may remain inside of the RW as Rising wedges are long term patterns. QCOM is sitting on bottom trend line almost like it is providing support...but then there is that gap that may never fill..worth my watching for a bit before buying more
Strong stock and I am hoping for targets 2 after this pull back
But nothing is ever a sure bet in the market
NV is high and short interest is low
I just like this stock. Great dividend and owning it does not keep me up at night (o:
Not a recommendation
PEG setup: QCOMQCOM pegged up over $100 and hasn't looked back. It's trading near ATH and has volume and support to test ATH again in near future.

$QCOM Qualcomm Day Trade setup
Potential day trade back to previous highs .
Barclays analyst Blayne Curtis raised the firm's price target on Qualcomm to $120 from $110 and keeps an Equal Weight rating on the shares. Handsets are one of a few markets that the analyst expects to see a recovery in 2021. However, Curtis believes his 1.4B handset base case is "generous," and needs to see a higher number in order to be more constructive on Qualcomm shares.


Iron TariHi guys!
This is W1 5% iron condor, following the strategy.
Short strike @109 and @121
Try by yourself to do the math, follow the strategy instruction!
Enjoy your wallet!
Tari.

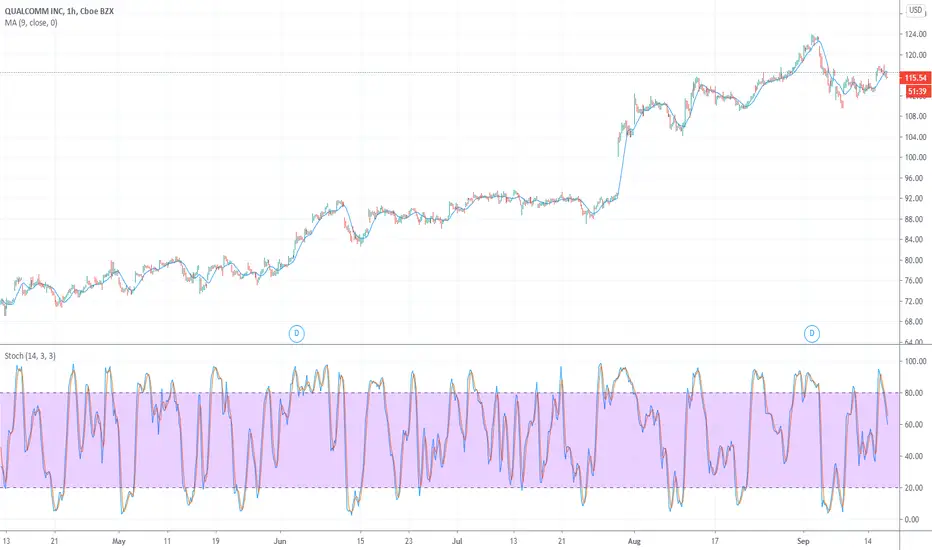
QCOM, enters monthly bullish trend. Expect Uptrend continuationQualcomm, Inc. (QCOM, $116.58) is predicted by Tickeron A.I.dvisor to grow by 4% to $121.24 or more within the next month. Keeping in mind similar previously-analyzed scenarios where the stock trended up during the month, the odds of an Uptrend continuation are 87%. Current price $115.85 is above $105.05 the highest support line found by Tickeron A.I. Throughout the month of 08/13/20 - 09/15/20, the price experienced a +3% Uptrend. During the week of 09/08/20 - 09/15/20, the stock enjoyed a +6% Uptrend growth.
Bullish Trend Analysis
The Stochastic Indicator suggests the stock price trend may be in a reversal from a downward trend to an upward trend. 38 of 60 cases where QCOM's Stochastic Oscillator exited the oversold zone resulted in an increase in price. Tickeron's analysis proposes that the odds of a continued upward trend are 81%.
The Aroon Indicator entered an Uptrend today. Tickeron A.I. shows that in 175 of 281 cases where QCOM Aroon's Indicator entered an Uptrend, the price rose further within the following month. The odds of a continued Uptrend are 62%.
Tickeron has a positive outlook on this ticker and predicts a further increase by more than 4.00% within the next month with a likelihood of 84%. During the last month, the daily ratio of advancing to declining volumes was 1.22 to 1.
The Tickeron Price Growth Rating for this company is 6 (best 1 - 100 worst), indicating outstanding price growth. QCOM’s price grows at a higher rate over the last 12 months as compared to S&P 500 index constituents.
The Tickeron SMR rating for this company is 10 (best 1 - 100 worst), indicating very strong sales and a profitable business model. SMR (Sales, Margin, Return on Equity) rating is based on comparative analysis of weighted Sales, Income Margin and Return on Equity values compared against S&P 500 index constituents. The weighted SMR value is a proprietary formula developed by Tickeron and represents an overall profitability measure for a stock.
The Tickeron Profit vs. Risk Rating rating for this company is 10 (best 1 - 100 worst), indicating low risk on high returns. The average Profit vs. Risk Rating rating for the industry is 82, placing this stock better than average.
The Tickeron PE Growth Rating for this company is 18 (best 1 - 100 worst), pointing to outstanding earnings growth. The PE Growth rating is based on a comparative analysis of stock PE ratio increase over the last 12 months compared against S&P 500 index constituents.